OUR 9TH YEAR OF PROVIDING PROPRIETARY CAPITAL MARKETS INTELLIGENCE ON THE CANNABIS / HEMP / PSYCHEDELIC SECTORS
Each week, Viridian publishes insights and analysis on completed capital raise transactions in the prior week, focusing on all equity and debt deals. Our analysis includes:
- Summary
- Outlook
- Best & Worst Perfromers
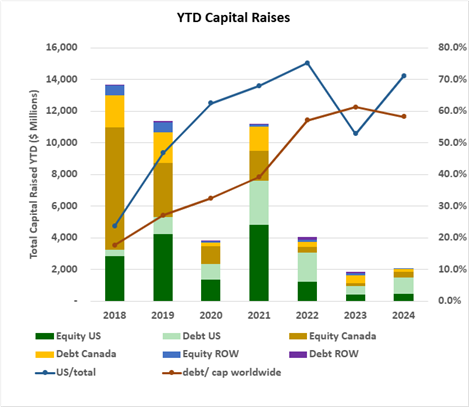
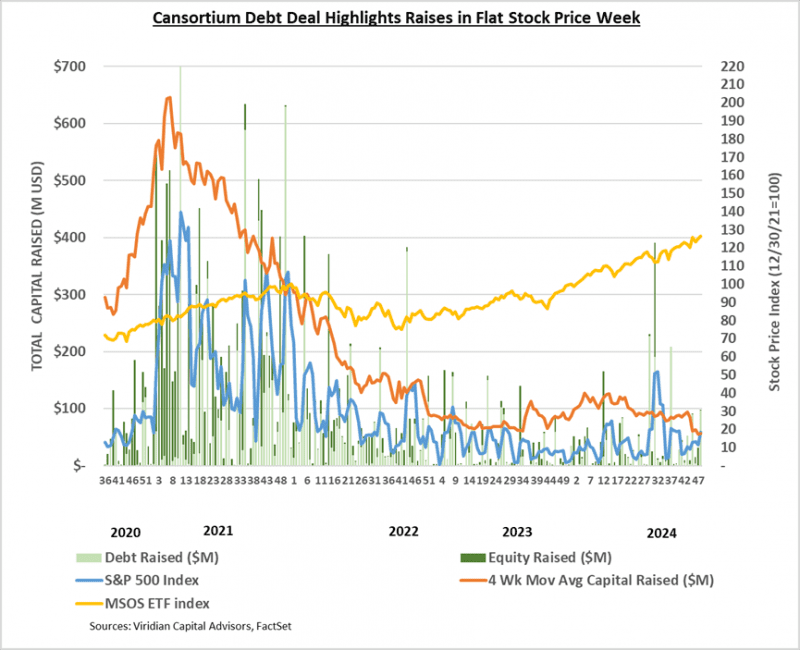
- YTD capital raises totaled $2,202.76M, up 20.0% from the same period in 2023. Debt as a percentage of capital raised on a worldwide basis remained steady at 60.1%, compared to 61.0% last year. The U.S. has a whopping 71.7% of capital raised in debt, compared to 57.2% in 2023.
- U.S. raises accounted for 72.4% of total funds, up from 53.1% at the same point in 2023. Raises from outside Canada and the U.S. represented 4.7% of the total funds raised, falling a little short of the average of 5.6% in the six previous years but is sharply lower than the 10.7% achieved in 2023.
- YTD raises by public companies accounted for 77.3% of total funds, the highest since 2021.
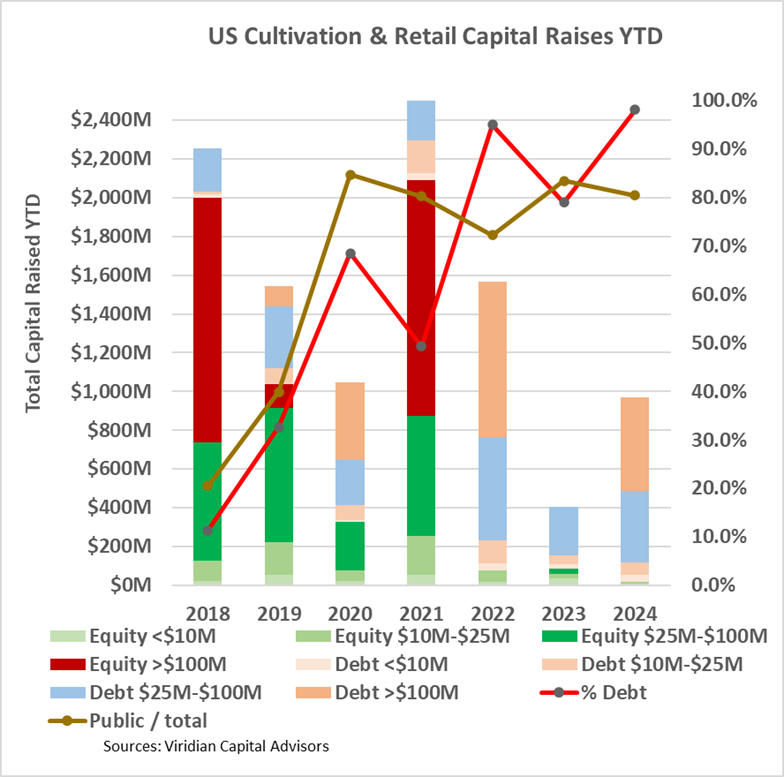
- Cultivation and Retail Sector capital raises are up 165% YTD. Debt accounts for 98.3% of the $1068.1M raised YTD, and around 75% of this was earmarked for refinancing existing debt. Large debt issues (>$100M) bounced back and represented 45.6% of capital raised compared to zero in 2023.
- Cannabis equities (as measured by the MSOS ETF) ended up 1.8% for the week, rising slightly above the all-time lows hit last week.
VIRIDIAN INSIGHTS
- WHAT LIMITS THE ATTRACTIVENESS OF CANNABIS TO INSTITUTIONAL INVESTORS?
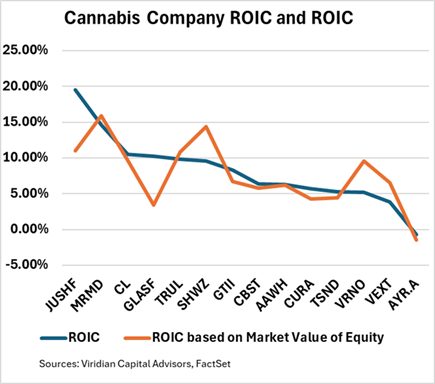
- This week’s Viridian Chart of the Week showed that most of the top cannabis companies have a Return on Invested Capital (ROIC) that is less than their cost of capital (WACC), and, in theory, this means they are not creating incremental value for their stakeholders. Of course, calculating the cost of capital is not an exact science, and we presented a table that showed a range of WACCs depending on asset betas, as well as debt/value ratios. This may limit the attractiveness of cannabis companies to institutional investors.
-
- The liquidity of public cannabis companies is pretty horrible. Each week, we calculate the Days to Trade Market Cap (DTMC). Since May 2024, the average of this stat is approximately 900 days. The implication is that an investor with a 5% position in the company may need 180 days to liquidate their investment. Uplisting will probably cure this problem, but that is likely to require more than just rescheduling. Liquidity issues look to drag on throughout 2025.
- Corporate Governance may need a tune-up. It is not unusual for cannabis companies to have several classes of stock. Often, the founders control the voting shares, although they hold a minority of shares. This is typically a non-starter for many institutional investors and senior exchanges. Often, the CEO is also the chairman of the board, and this is frowned upon. So, uplifting to senior exchanges may require a bit of maneuvering to make listing requirements: nothing remarkable, just another step along the way.
- THE EXTENSION OF OUR OPTIONS VALUATION FRAMEWORK TO THE DEBT SHOWS THAT “AMEND, EXTEND, AND PRETEND” IS A RATIONAL STRATEGY.
- In our equity analysis, we presented what to some is a counterintuitive, though theoretically sound viewpoint: if you are an equity holder in a distressed business, where the value of the assets is perhaps only slightly over or under the amount of debt, you should want high risk and high volatility. In essence, you are behind, and there are only a few innings left in the game (until your debt matures). Most of the upside accrues to you and your debtholders take most of the hit on the downside. After all, the worst your equity can be worth is zero, So swing for the fences, try to steal bases, etc.
- That is, of course, why restrictive debt covenants exist. They give the debtholders the right to call the game early, preventing the equity from gambling away all of the value.
- The framework has some interesting ramifications. What if the value of the assets is less than the face value of the debt? What should a rational debt holder do? It turns out that “amend, pretend, and extend” is not irrational. Allowing for a little extra risk may not be unreasonable either because, in this situation, the upside will be captured by the debt. So, we see the behavior of lenders like Gotham Green, who were faced with a situation like MedMen. It might not have turned out as desired, but the strategy was rational. Provide minimum liquidity, allow growth even if it entails risk, but keep a tight rein through covenants. Eat more and more of the equity through more warrants and reduced exercise prices so that if the risk really pays off, you get more than debt returns. It’s all quite rational. The more challenging decision is when do you actually throw in the towel and call a hard default?
- We are starting to see more of that, as in Pelorus/StateHouse. Whether it becomes a trend depends on the direction of asset values. We never thought we would be looking at market caps where they are, nearing the end of 2024. We know there is a massive upside, but have we hit bottom yet?
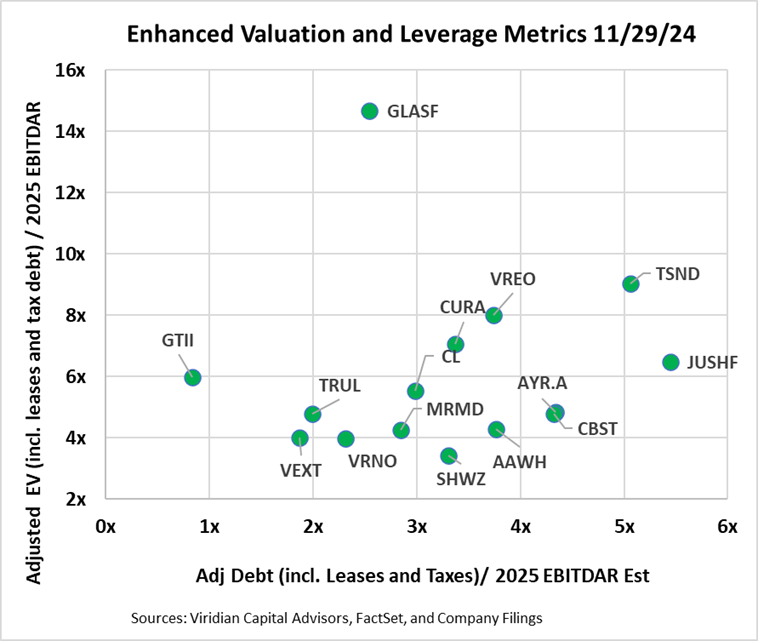
- MSO VALUATION AND FINANCIAL FLEXIBILITY DEPICTED BY FOUR GRAPHS. BOTTOM LINE: MSOs ARE TRADING AT HIGHER VALUATION MULTIPLES AND HAVE HIGHER LEVERAGE THAN STANDARD MEASURES INDICATE!
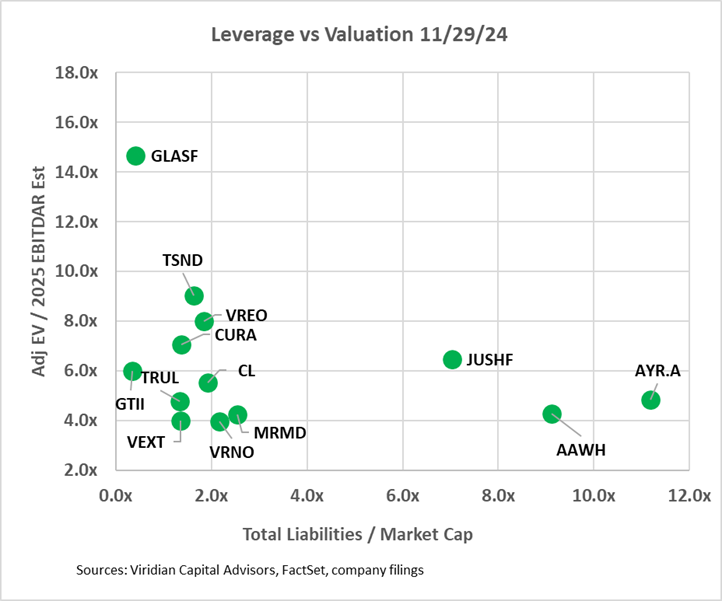
- The four graphs below seek to map the financial options available to eighteen of the largest MSOs based on their Valuation, Leverage, and Liquidity. We have updated our measures to look at 2025 EBITDAR estimates as we believe most investors are now looking to these values in their valuations.
- The first two graphs present different versions of EV/EBITDA on the vertical axis and Debt/EBITDA on the horizontal axis.
- The first graph presents our latest view of the most appropriate valuation and financial statement-based leverage metrics: Adjusted E.V. / 2025 EBITDAR and Adjusted net debt / 2025 EBITDAR. In calculating Adjusted Net Debt, we make several key assumptions: 1) Leases that are included on the balance sheet are considered debt. We view most leases in the cannabis space as equivalents to equipment loans or mortgage loans. While it is true that a lease default does not necessarily trigger a cascade of events leading to bankruptcy, the distinction is often meaningless in cannabis due to the mission-critical nature of many long-term leases and the absence of bankruptcy protection in cannabis. 2) We consider any accrued taxes (including uncertain tax liability accounts listed as long-term liabilities) in excess of the most recent quarterly tax expense to be debt. Our calculation of enterprise value is now market cap plus debt plus leases plus tax debt minus cash. We now use EBITDAR rather than EBITDA since lease expense is taken out prior to EBITDA.
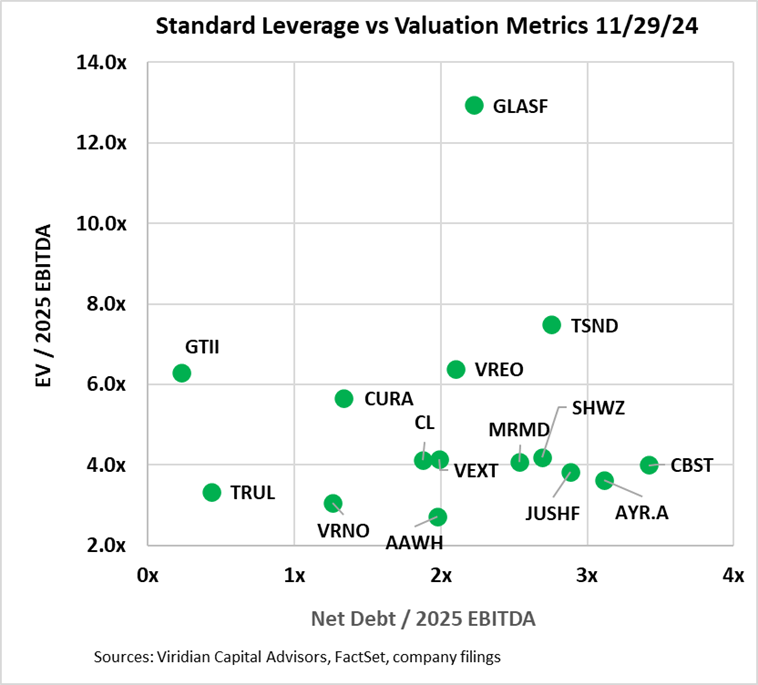
- The second graph utilizes EBITDA and employs the traditional calculations of both debt and enterprise values, leaving out leases and taxes.
- Our adoption of new metrics tends to make the companies look less cheap and more leveraged.
- Surprisingly, eight of the companies on the enhanced metric chart are still above 3x leverage, which we have identified as the boundary of sustainability in a 280e environment. Four companies now exceed 4x leverage, which we believe will be close to the maximum sustainable post 280e.
- Valuation metrics can be deceiving when a company is just achieving positive cash flow status. Glass House, for example, has enormous valuation multiples. Still, it is based on small EBITDAs that are likely to expand significantly in the next several years.
- The third graph looks at leverage through the lens of total liabilities to market cap. We believe this is the single best measure of leverage because it is a direct reflection of the market’s assessment of the value of a company’s assets in excess of its liabilities and is sensitive to changes in market perception of a company’s future.
- On the bottom left are companies with Adj E.V./2025 EBITDAR of under 7x and total liabilities to market cap under 2x. The group includes Vext, GTI, PLTH, Verano, and Cresco. Companies in this quadrant are right to consider stock repurchases or using cash in acquisitions. They can afford some additional debt and can take advantage of the ongoing dislocation in equity prices.
- In the middle, between 2x and 5x total liabilities/market cap, we see Ascend, AYR, Jushi, and MariMed. Each of these has significant upside catalysts that could mitigate or exacerbate the excess leverage. However, several upside catalysts seem to be neutralized in the short run. Florida rec is indefinitely delayed, PA rec does not seem to be happening this year, and VA rec is probably on hold until 2026.
- On the right lies Jushi, AYR, Ascend, and Schwazze (not pictured). AYR has moved into our danger zone, but its metrics are not nearly as troublesome as the Schwazze. At the top left are companies with high valuation metrics and low leverage. These companies should look to do an equity issuance depending on their positioning in the liquidity graph below.
-
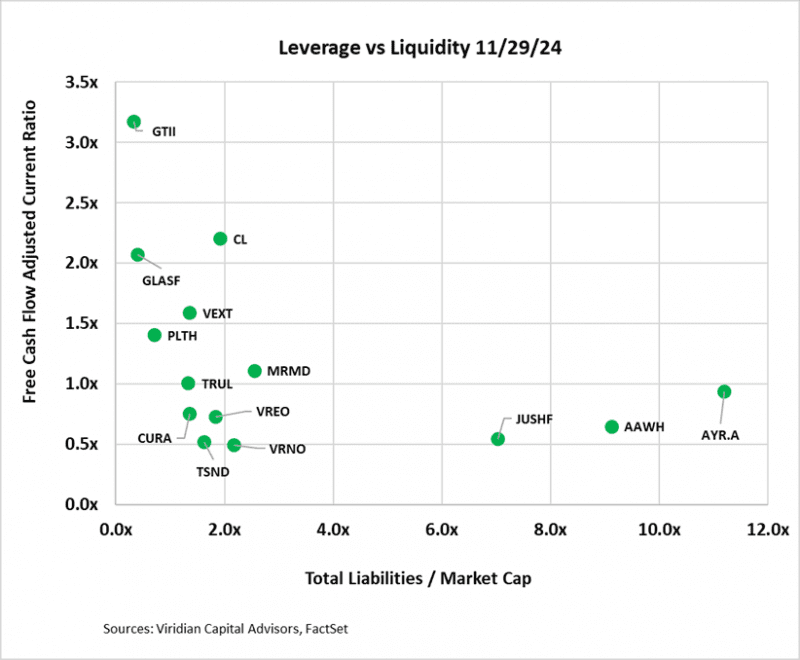
- The fourth graph introduces the free cash flow adjusted current ratio liquidity measure into the mix. Companies with less than 1x on this measure will likely have to raise capital next year. Surprisingly, eight of the companies fall into this bucket (including Schwazze, not pictured).
- The bottom left group, including Curaleaf, Verano, and Vireo, has low leverage but is below the critical 1x liquidity level. This suggests that Curaleaf and Verano should take advantage of the robust debt market to augment their liquidity (note that Curaleaf just did this). Vireo is a more challenging call. Their adjusted net debt/ EBITDAR is relatively high, which makes them an unlikely net debt issuer and suggests asset sales.
- On the top left, we find companies with adequate liquidity and low market leverage, including both GTI and TerrAscend, due to their recent refinancings.
- Companies in the lower middle-to-right generally have constrained liquidity and high leverage, a potentially dangerous combination in a capital-constrained environment. Cannabist’s liquidity is understated in the graph and is likely to be OK based on announced asset sales. 4Front and Schwazze (both not pictured because they are off the scale to the right), despite making moves to restructure their debt, continue to have inadequate liquidity and excess leverage and should be watched carefully. We note that FFNT has no consensus on 2025 EBITDA estimates, but a full year of Illinois cultivation will probably make leverage look significantly better.
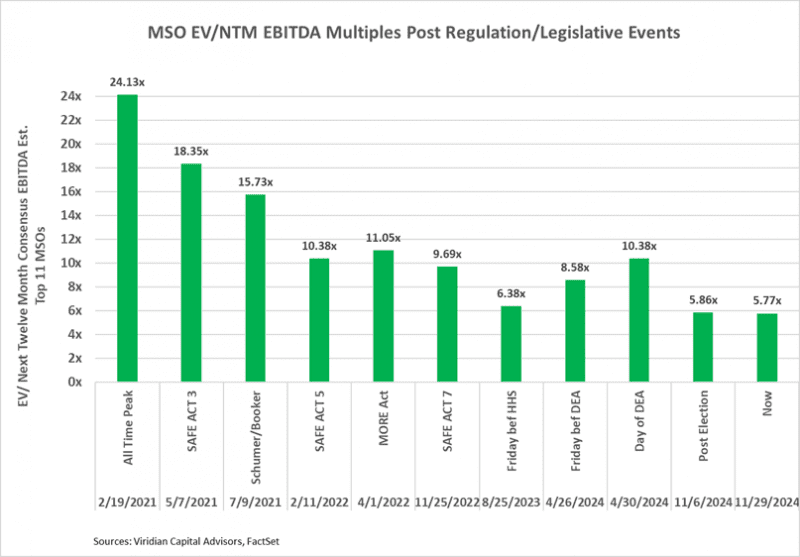
- EV/LTM MULTIPLES ARE NOW LOWER THAN BEFORE THE ORIGINAL HHS RESCHEDULING ANNOUNCEMENT ON 8/30/23
- We continue to believe that at current levels, U.S. MSOs have enormous upside potential. The graph below shows the multiples reached after a number of past legislative/regulatory events. It makes clear that a doubling of prices is a reasonable assumption. We recommend a balanced portfolio that leans toward the companies in the top half of the Viridian Credit Tracker model ranking.
- Despite the challenges to growth discussed above, we believe that many companies have become stupidly cheap. We recommend a “don’t step in the doggy do do” strategy. With refinancing risks made worse by cratering stock prices, this is no time to be a hero. Focus on building a diversified portfolio of companies ranked in the top 10 in our credit rankings. Put them in your portfolio and follow the total liabilities to market cap indicator that we recommended several weeks ago, as well as the credit tracker rankings. And resist the urge to look at the stock prices every day!
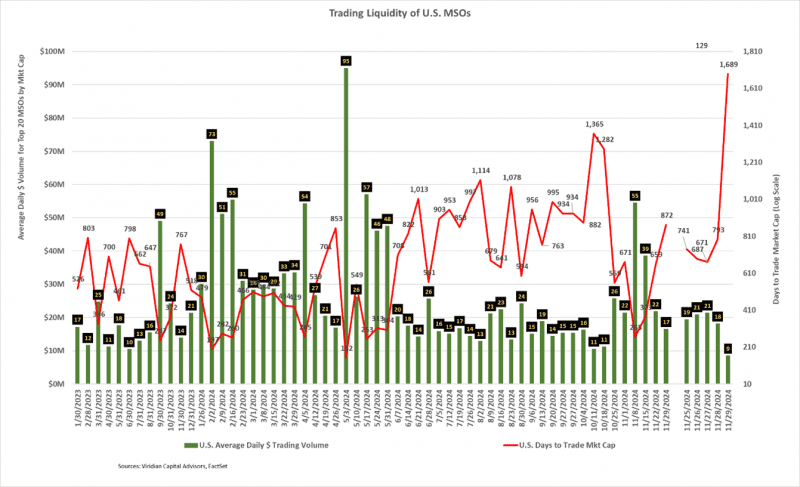
- TRADING LIQUIDITY STAYS HIGHER THAN YTD AVERAGES: DOLLAR VOLUME IS DOWN BUT NOT AS MUCH AS MARKET CAPS.
- The average daily dollar volume of $17M for the week ending 11/29/24 reflects the holiday-shortened trading week but exceeds the same week last year.
- The Days to Trade Market Cap (DTTMC) series depicts the number of days it would take to trade the market cap of a stock or group of stocks. The current DTTMC of 872 implies that an investor who acquired a 5% position in the stock, assuming he wanted to be less than 25% of the average daily dollar volume, would require 174 days to trade out of his position.
- GIVING CREDIT WHERE CREDIT IS DUE
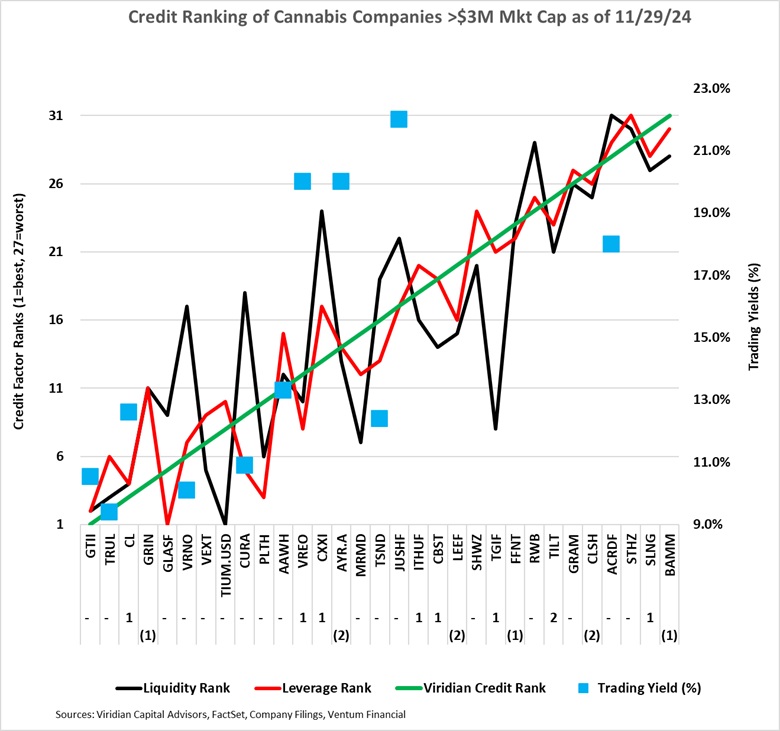
- The chart below shows our updated 11/29/24 credit rankings for the 31 U.S. cannabis companies with over $3M market cap. The number below the ticker symbol indicates the change in credit ranking since last week, where a negative number suggests credit deterioration, while a positive indicates improvement.
- We have made recent upgrades to our credit model to more accurately treat lease liabilities and account for non-payment of taxes as a financing source.
- The blue squares show the offered-side trading yields for each Company. Trading yields have declined significantly since the HHS rescheduling announcement. We are expecting the round of recent refinancings to re-rate the landscape of cannabis debt. Note: The prices shown were obtained prior to the election, as well as some of the recent earnings releases. We consider them to be only indicative, as we expect updated pricing to reflect the dislocations observed in the equity market.
- There were few significant ranking changes in the holiday-shortened week.
- AYR was the biggest credit decliner this week as investors are focused on the problematic refinancing task facing the company in 2026 after its big bet on Florida failed to come through. AYR’s yield doesn’t look nearly as cheap as it did pre-Florida. We expected the revenue gains for the company in Florida to fuel solid cash flow gains since much of the spending for cultivation improvements has already occurred. There are no near-term debt triggers because the company’s maturities have substantially been pushed out to December 2026. However, the approximately $300 million of 2026 maturities now represent 3.7x the company’s market cap, compared to 1.1x on 11/1/24. The 3.7x exceeds the level of maturities AYR faced at the end of 2024 before it conducted a somewhat disastrous restructuring/refinancing deal. We see asset sales as a possibility to close that gap, and the company’s new Virginia license jumps up as a prime possibility. Verano just paid $90M for a combination of Cannabist cultivation and retail facilities, which evidently require some refurbishment. So, what would a license in VA bring?
- Cannabis equities (as measured by the MSOS ETF) ended up 1.8% for the week, rising slightly above the all-time lows hit last week.

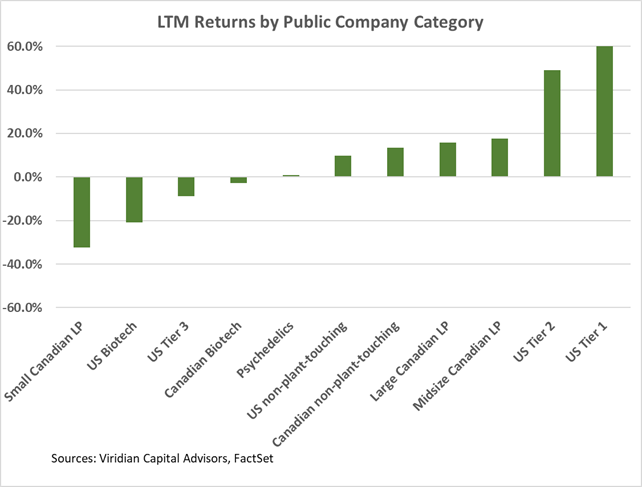
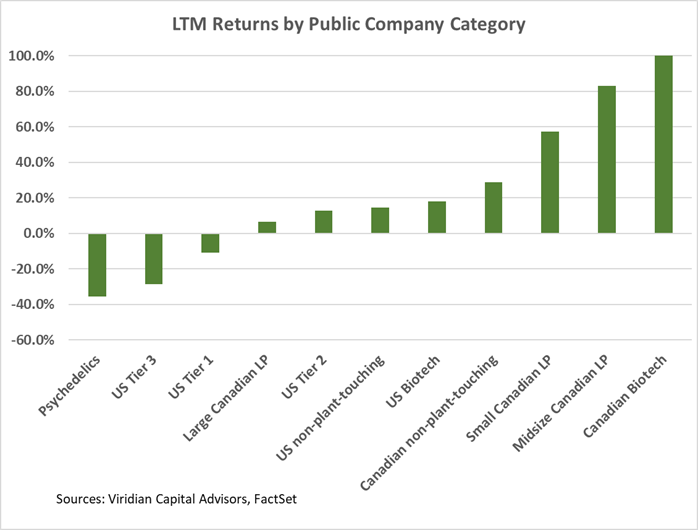
Trailing 52-Week Returns by Public Company Category:
-
- No changes in the ordering of performance between company types this week.
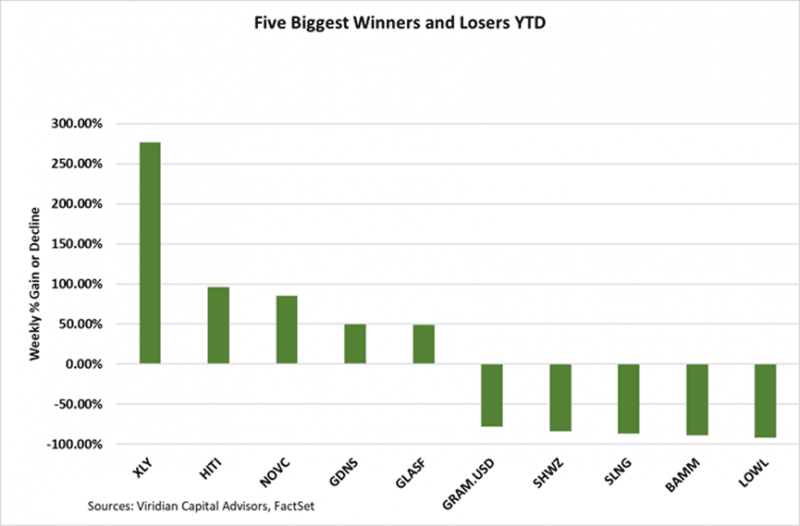
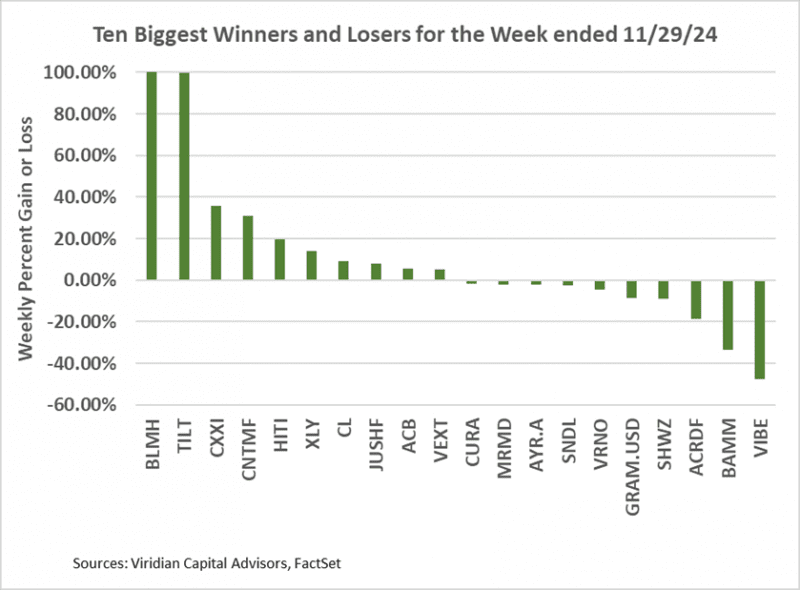
Best and Worst Performers for the week:
- Cansortium was one of the biggest gainers following the refinancing of its senior secured debt, with the ability to obtain additional growth financing.