OUR 9TH YEAR OF PROVIDING PROPRIETARY CAPITAL MARKETS INTELLIGENCE ON THE CANNABIS / HEMP / PSYCHEDELIC SECTORS
Each week, Viridian publishes insights and analysis on completed capital raise transactions in the prior week, focusing on all equity and debt deals. Our analysis includes:
- Summary
- Outlook
- Best & Worst Perfromers
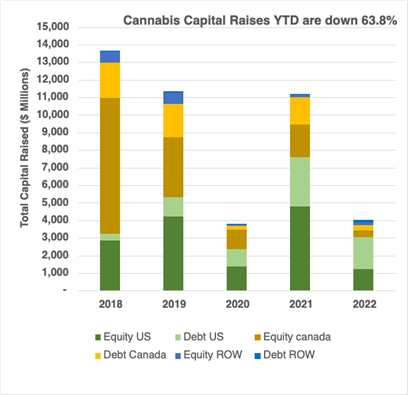
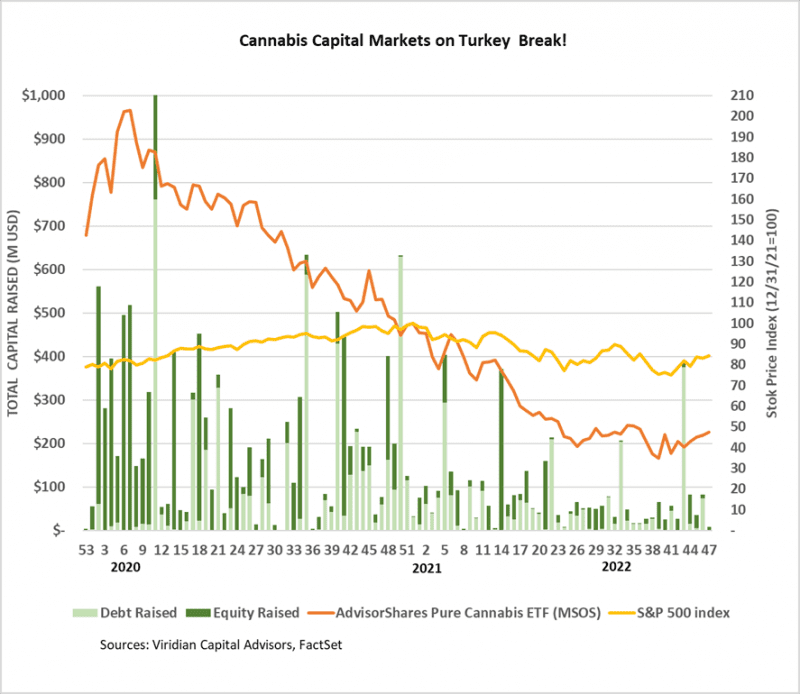
Cannabis capital raises are off 63.8% YTD:
- Total Equity issuance is off 74.4%, and total debt issuance is down 47.4%.
- U.S. debt is down only 35.2%, while Canadian debt is down a more significant 80.4%.
- At 57.1% of total capital raised, debt remains the highest in history for comparable periods.
- Public companies accounted for 74.5% of total financing YTD, down from 79.6% in 2021.
- The graph below shows that U.S. activity dominated capital raises for the first forty-seven weeks of 2022, with 75.2% of all capital raised.
- International capital raises of $318.7M represented 7.9% of total capital raises, exceeding the previous record of 6.3% in 2019.
-
- Cannabis stock prices (measured by the MSOS ETF) were up 3.24% last week in the holiday shortened low volume trading.
-
- It’s coming up on do-or-die time for the SAFE+ Act. We believe the bill will be inserted into the NDAA defense authorization bill, which usually gets voted on in the latter half of December. Although many commentators expect an announcement in the next few days, we believe investors will be kept on pins and needles until the end. We still believe a passage is around a 70% probability.
-
- We expect a meaningful lift to equity prices if SAFE passes, but we continue to believe the more important impacts will be indirect. SAFE will likely encourage more financial institutions to provide custodial services for cannabis equities, increasing the liquidity of the stocks, promoting more trading volume, and enticing new investors. We believe this virtuous circle will eventually lead the exchanges to allow the uplisting of cannabis equities.
-
- Investors are watching liquidity closely as this continues to be one of the most restrictive capital markets we can remember. The Viridian Capital Chart of the Week showed the five best and five worst companies for third-quarter cash flow from operations. We also calculated an adjusted cash flow assuming companies brought their tax liabilities to 90 days’ worth of taxes. The results were somewhat concerning for the bottom group with annualized cash flow from operations deficits larger than market caps.
-
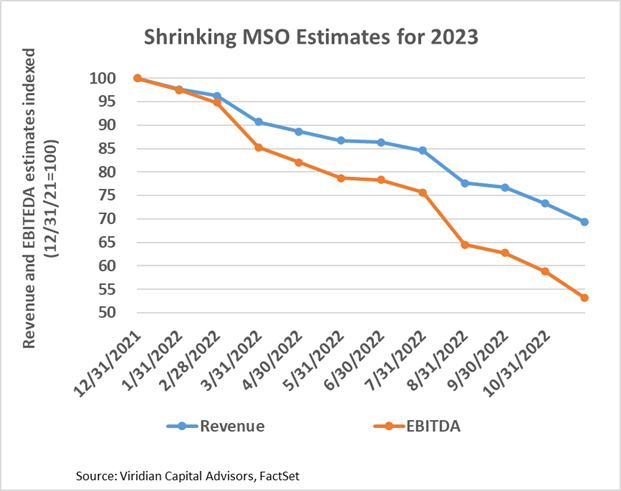
- Third-quarter earnings releases were a mixed bag, and analysts’ estimates for 2023 EBITDA will continue to erode.
The U.S. Cultivation & Retail sector has experienced a similar change in capital raise activity, although the components have changed significantly:
- Total capital raised is down 62.6%, but equity capital raised is down approximately 96.3%.
- Debt financing is down 28.0% YTD but accounts for about 95.0% of all capital raised; private companies raised 27.1% of it.
- 72.1% of total capital raises YTD were completed by public companies compared to 80.5% in 2021.
- In 2022, there have been no equity deals above $25M.

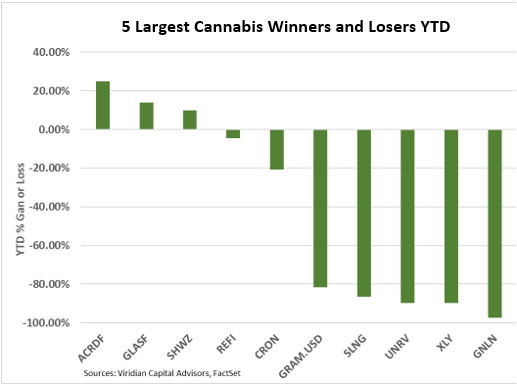
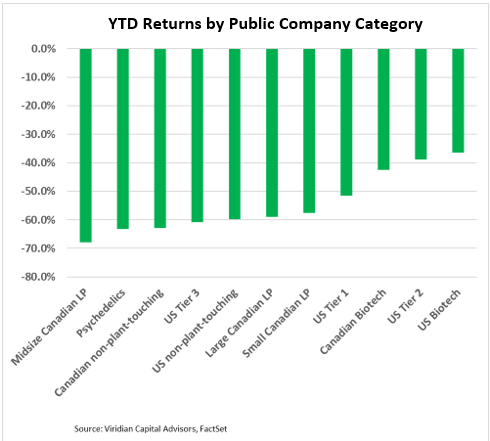
YTD Returns by Public Company Category
- The most significant change from last week was that psychedelics slid two more notches to become the second-worst category regarding YTD stock performance.
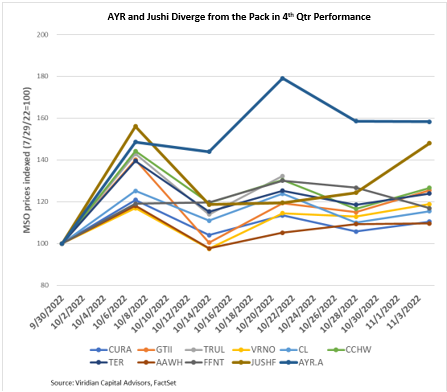
- The market is still strongly differentiating between MSOs, and the gap in the last twelve-week stock performance between the best performer (GTI (GTII: CSE) up 26.9%) and the worst (4Front (FFNT: CSE) down 32.2%) has widened to 68 points. But since August, it’s been Green Thumb and everyone else. GTI has been the lone gainer over the last three months.
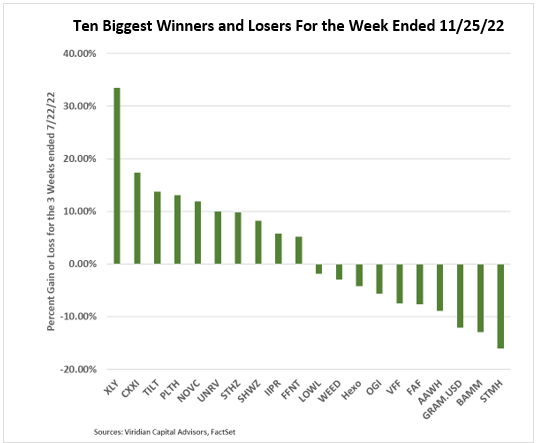
Best and Worst Performers of the last week and YTD
- Auxly Cannabis (XLY: CSE) was the week’s biggest percentage gainer, up 33% on less than ½ cent of improvement. We saw no news, but at nearly 8x debt/ market cap and trading less than $.01, the stock is trading as a deep out-of-the-money option and is reacting purely to volatility.
- Tilt Holdings (TILT: NEO) was another strong performer, up 13.8%, as investors digested the company’s strong cash flow performance in the third quarter and became optimistic about its ability to meet its debt maturities successfully.
- TPCO (GRAMF: OTC) was one of the week’s worst performers, down 12%. The company turned up on our chart as the worst third-quarter cash flow from operations relative to market cap. The annualized CFFO deficit was more than 250% of the market cap