OUR 9TH YEAR OF PROVIDING PROPRIETARY CAPITAL MARKETS INTELLIGENCE ON THE CANNABIS / HEMP / PSYCHEDELIC SECTORS
Each week, Viridian publishes insights and analysis on completed capital raise transactions in the prior week, focusing on all equity and debt deals. Our analysis includes:
- Summary
- Outlook
- Best & Worst Perfromers
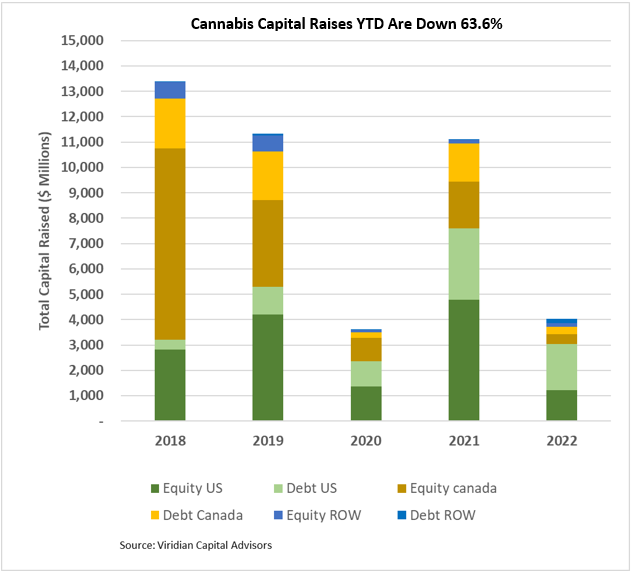
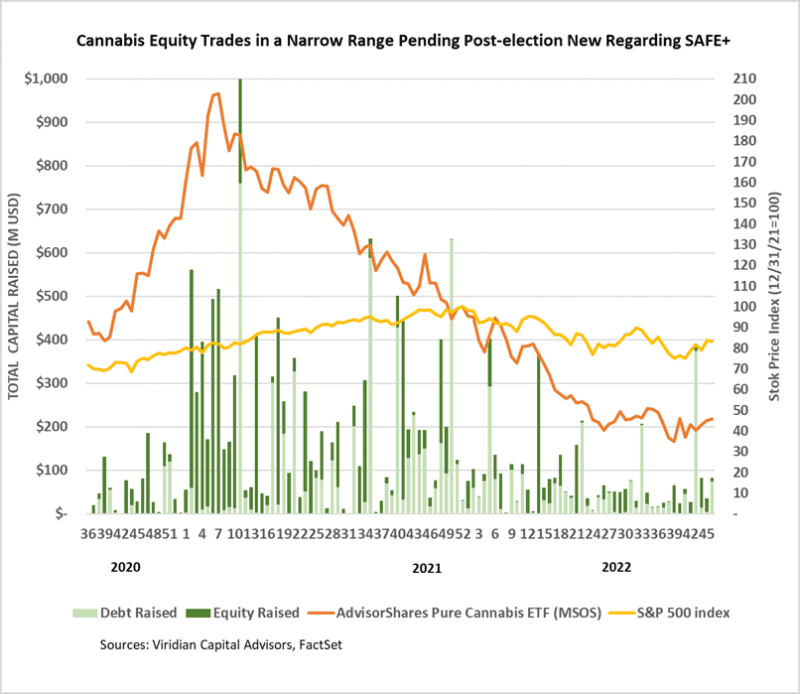
Cannabis capital raises are off 63.6% YTD:
- Total Equity issuance is off 74.5%, and total debt issuance is down 46.7%.
- U.S. debt is down only 35.2%, while Canadian debt is down a more significant 79.7%.
- At 57.2% of total capital raised, debt remains the highest in history for comparable periods.
- Public companies accounted for 74.5% of total financing YTD, down from 79.6% in 2021.
- The graph below shows that U.S. activity dominated capital raises for the first forty-six weeks of 2022, with 75.3% of all capital raised.
- International capital raises of $319M represented 7.9% of total capital raises, exceeding the previous record of 6.3% in 2019.
- Cannabis stock prices (measured by the MSOS ETF) were up 1.65% last week, as much of the cannabis market gathered in Las Vegas for MjBiz.
- Our critical takeaways from the conference:
-
- The people we spoke with that we consider most “in the know” are more bullish than we are that SAFE+ will pass in the lame-duck session. Although this will probably dramatically impact equity prices, the more acute effects are indirect. In particular, SAFE will likely encourage more financial institutions to provide custodial services for cannabis equities, increasing the liquidity of the stocks, promoting more trading volume, and enticing new investors. We believe this virtuous circle will eventually lead the exchanges to allow the uplisting of cannabis equities.
- Conference attendees were less optimistic about near-term industry conditions. Few people believe the price compression experienced across the industry will reverse soon. Nor do they believe inflationary pressures on costs will decrease quickly, resulting in continuing pressure on margins. The time lag between when a new market opens and when wholesale prices begin to drop seems to have shortened, partially because industry participants have become quicker at building new cultivation capacity.
- Companies are paying more attention to cost control and capital budgeting in attempts to become cash flow positive.
- Industry consolidation is likely to accelerate with or without the SAFE+
-
- Third-quarter earnings releases were a mixed bag, and analysts’ estimates for 2023 EBITDA will continue to erode.
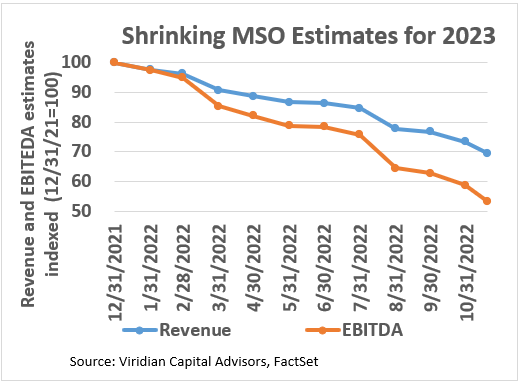
- Third-quarter earnings releases have been a mixed bag. Curaleaf (CURA: CSE), Green Thumb (GTII: CSE), Ascend (AAWH: OTC), and Schwazze (SHWZ: OTC) all had positive earnings surprises, while Trulieve (TRUL: CSE), Planet 13 (PLTH: CSE), MariMed (MRMD: CSE), Acreage (ACRDF: OTC), and Lowell Farms (LOWL: CSE) all disappointed. The chart below shows the revenue and EBITDA consensus estimates and actuals, ordered from the most significant EBITDA % misses to the most prominent EBITDA % beats.
The U.S. Cultivation & Retail sector has experienced a similar change in capital raise activity, although the components have changed significantly:
- Total capital raised is down 62.6%, but equity capital raised is down approximately 96.3%.
- Debt financing is down 28.0% YTD but accounts for about 95.0% of all capital raised; private companies raised 27.1% of it.
- 72.1% of total capital raises YTD were completed by public companies compared to 80.5% in 2021.
- In 2022, there have been no equity deals above $25M.

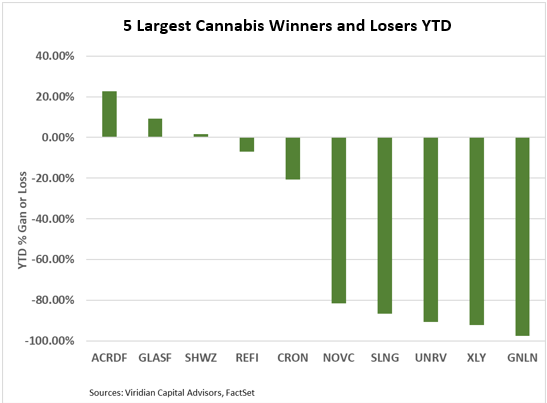
YTD Returns by Public Company Category
- The most significant change from last week was that psychedelics slid one notch.
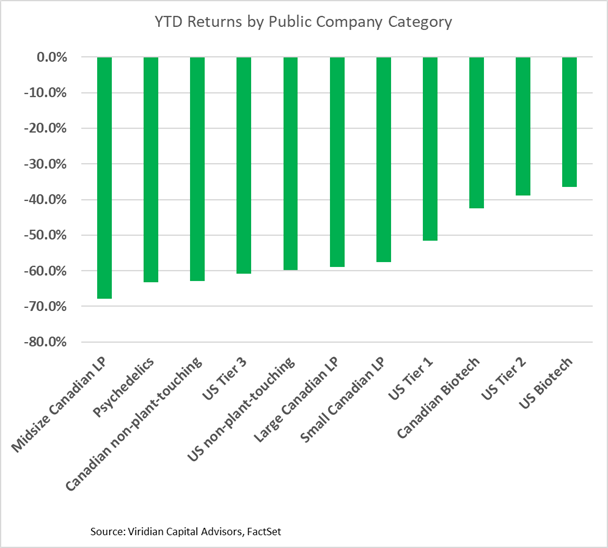
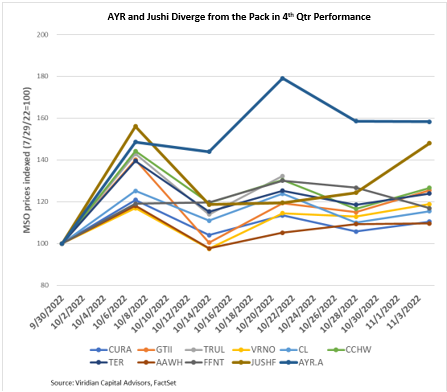
- The market is still strongly differentiating between MSOs, and the gap in the last twelve-week stock performance between the best performer (GTI (GTII: CSE) up 26.9%) and the worst (4Front (FFNT: CSE) down 32.2%) has widened to 68 points. But since August, it’s been Green Thumb and everyone else. GTI has been the lone gainer over the last three months.
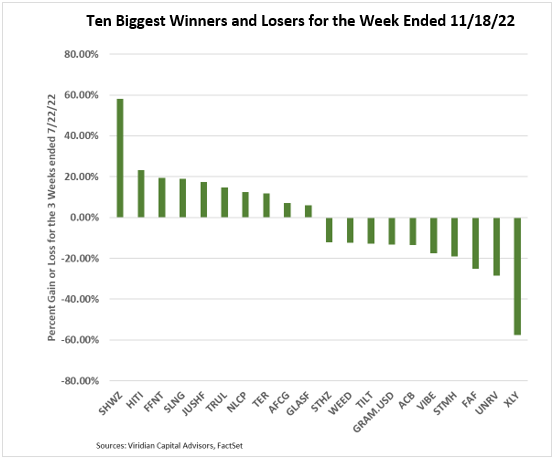
Best and Worst Performers of the last week and YTD
- Schwazze (SHWZ: CSE) was the week’s biggest gainer, up 58% on a combination of positive news items. The company beat 3rd quarter EBITDA expectations by 11.8% while recording the strongest EBITDA margins (37%) for tier-one or two operators. Additionally, Chairman Justin Dye purchased approximately $667,000 of stock.
- California companies Unrivaled Brands (UNRV: OTC), Stem Holdings (STMH: OTC), Vibe Growth (VIBE: CSE), and Lowell Farms (LOWL: CSE) repeated their last week’s positioning among the biggest losers, accompanied by several Canadian names including Auxly (XLY: CSE), Fire & Flower (FAF: CSE). Aurora (ACB: Nasdaq) and Canopy Growth (WEED: TSX).