OUR 9TH YEAR OF PROVIDING PROPRIETARY CAPITAL MARKETS INTELLIGENCE ON THE CANNABIS / HEMP / PSYCHEDELIC SECTORS
Each week, Viridian publishes insights and analysis on completed capital raise transactions in the prior week, focusing on all equity and debt deals. Our analysis includes:
- Summary
- Outlook
- Best & Worst Perfromers
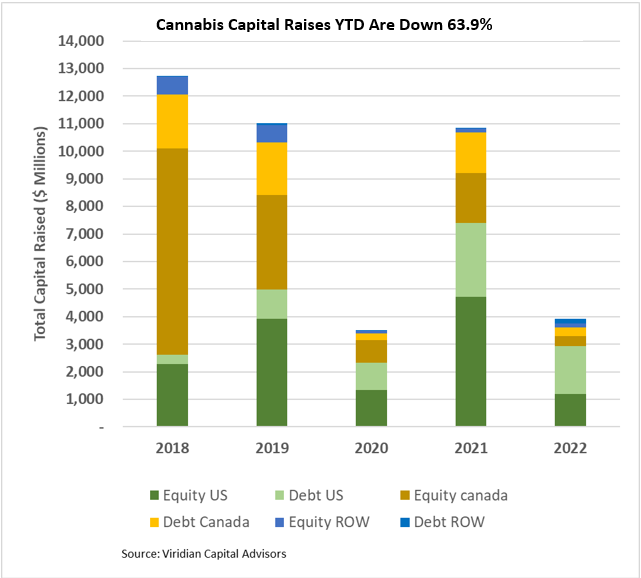
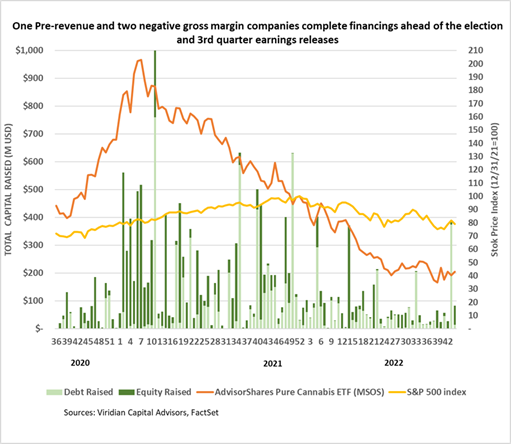
Cannabis capital raises are off 63.9% YTD:
- Total Equity issuance is off 74.7%, and total debt issuance is down 46.4%.
- U.S. debt is down only 34.5%, while Canadian debt is down a more significant 79.4%.
- At 56.9% of total capital raised, debt remains the highest in history for comparable periods.
- Public companies accounted for 73.6% of total financing YTD, down from 78.9% in 2021.
- The graph below shows that U.S. activity dominated capital raises for the first forty-four weeks of 2022, with 74.8% of all capital raised.
- International capital raises of $319M represented 8.1% of total capital raises, exceeding the previous record of 6.4% in 2019.
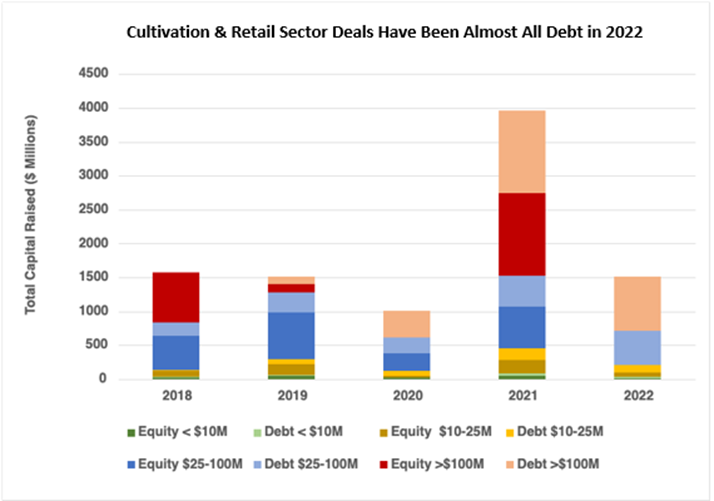
The U.S. Cultivation & Retail sector has experienced a sharper change in capital raise activity:
- Total capital raised is down 61.8%, but equity capital raised is down approximately 96.3%.
- Debt financing is down 23.4% YTD but still accounts for about 94.9% of all capital raised; private companies raised 24.9% of it.
- 72.9% of total capital raises YTD were completed by public companies compared to 79.8% in 2021.
- In 2022, there have been no equity deals above $25M.
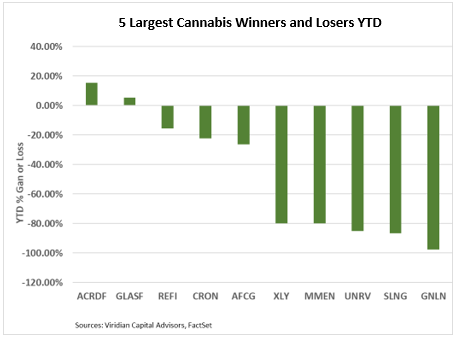
YTD Returns by Public Company Category
- What a difference a week can make! U.S. tier-one MSOs lost four places in our ranking of YTD stock performance in a dramatic demonstration that liquidity can cut both ways. U.S. Biotech and Psychedelics were two of the gainers.
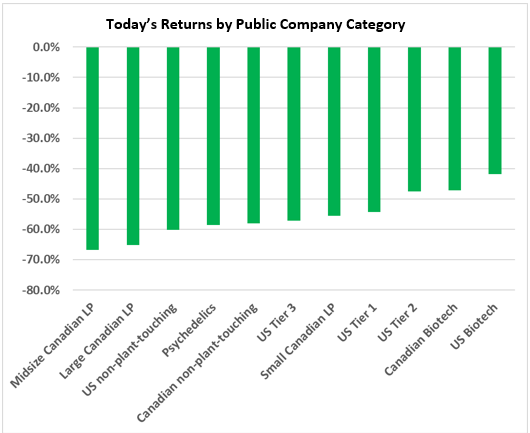
- The market is still strongly differentiating between MSOs, and the gap in the last twelve-week stock performance between the best performer (GTI (GTII: CSE) up 26.9%) and the worst (4Front (FFNT: CSE) down 32.2%) has widened to 68 points. But since August, it’s been Green Thumb and everyone else. GTI has been the lone gainer over the last three months.
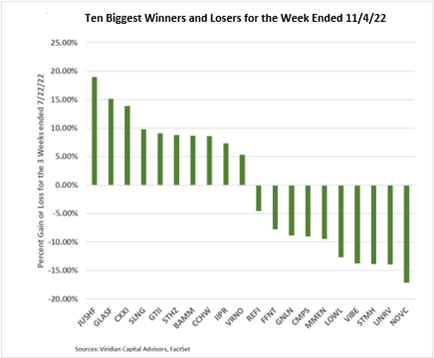
Best and Worst Performers of the last week and YTD
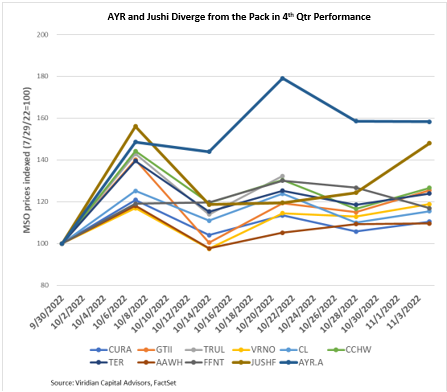
- Jushi (JUSHF: OTC) was the week’s best performer, up 18.95%. We did not see any specific news to account for the gain.
- California companies Unrivaled Brands (UNRV: OTC), Stem Holdings (STMH: OTC), Vibe Growth (VIBE: CSE), and Lowell Farms (LOWL: CSE) were among the biggest losers of the week, all down in the 12%-14% range.