OUR 9TH YEAR OF PROVIDING PROPRIETARY CAPITAL MARKETS INTELLIGENCE ON THE CANNABIS / HEMP / PSYCHEDELIC SECTORS

Capital Raises

Past Charts

Capital Raises

Capital Raises Summary

Each week, Viridian publishes insights and analysis on completed capital raise transactions in the prior week, focusing on all equity and debt deals. Our analysis includes:

  • Summary
  • Outlook
  • Best & Worst Perfromers

Quick Links

YTD Analysis

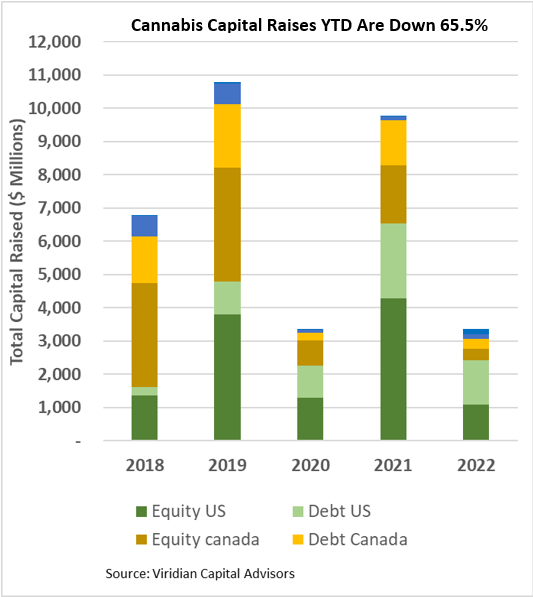
Cannabis capital raises are off 65.5% YTD

  • Total Equity issuance is off 74.3%, and total debt issuance is down 50.5%.
  • U.S. debt is down only 41.1%, while Canadian debt is down a more significant 78.4%.
  • At 55.0% of total capital raised, debt remains the highest in history for comparable periods.
  • Public companies accounted for 73.9% of total financing YTD, down from 83.2% in 2021.
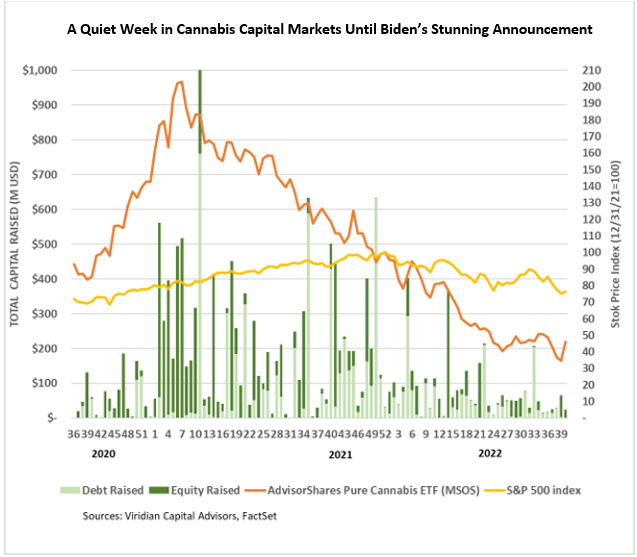
  • The graph below shows that U.S. activity dominated capital raises for the first thirty-eight weeks of 2022, with 71.5% of all capital raised.

Market Commentary and Outlook

  • Cannabis stock prices (measured by the MSOS ETF) exploded by 32.4% in reaction to Biden’s Friday surprise announcement, marking the largest one-week gain since the ETF began in September 2020.
  • Despite the outsized gains, cannabis prices finished the week 54% lower YTD and have drifted lower.
  • The macro-environment remains perilous, and recent job market strength appears to quash the likelihood of a near-term Fed pivot. We continue to believe there is a high likelihood of a recession in 2023.
  • Meanwhile, the negative industry trends of commodification-driven wholesale price declines, margins weakened by inflation, and pressured consumers, continue unabated.
  • None of that mattered this week as dreams of near-term legalization took the stage.
  • We believe the critical near-term importance of Biden’s announcement is that his federal pardons and encouragement of states to expunge front runs one of the most contentious issues surrounding the SAFE+ bill. This should significantly increase the likelihood of SAFE+ passing in the lame-duck session. Furthermore, we believe the indirect impacts of SAFE+ will be the most important ones for investors: increasing bank custodial services for cannabis stocks, which we think will eventually lead to greater trading liquidity, a broader investor base, and uplisting.
  • As to rescheduling, it is likely to take much longer than popular belief. Biden is on record from the campaign saying that he believes cannabis should be moved to schedule 2. This would have minimal positive impact:  It would neither provide for a legalized adult-use market, remove 280e, nor result in uplisting.
  • It is less clear what benefits a downlisting to schedule 3 or 4 would have. On the positive side, it would remove 280e, but on the negative side, it would greatly expand the role of the FDA, an agency with close ties to the Pharma industry. The FDA is unlikely to approve the smokeable flower products that make up most of the adult-use market.
  • We think the likelihood of complete de-listing is very low, at least in the next 2-3 years.
  • Our view is that the best-case near-term scenario is the passage of SAFE+ combined with a 280e eliminating down schedule that leaves the states in control of cannabis regulations. Full legalization and interstate commerce would be disastrous for all limited license states and most MSOs. Most states only legalized cannabis for tax revenue: expect them to fight to keep their tax revenues and jobs intact.

This Week Sector Focus

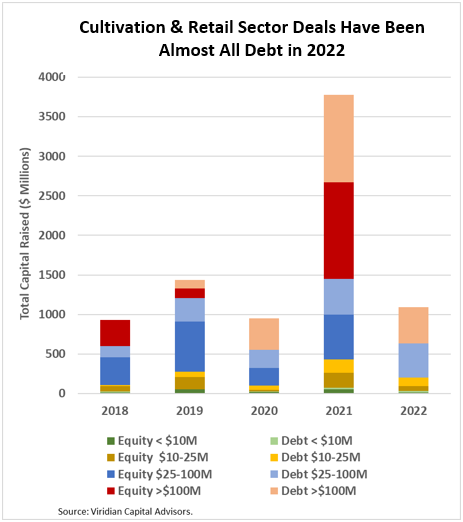
The U.S. Cultivation & Retail sector has experienced a sharper change in capital raise activity:

  • Total capital raised is down 71.1%, but equity capital raised is down approximately 96%.
  • Debt financing is down 41.7% YTD and accounts for about 93% of all capital raised; private companies raised a record 37% of it.
  • 62.8% of total capital raises YTD were completed by public companies compared to 79.3% in 2021.
  • In 2022, there have been no equity deals above $25M!

Capital Raises vs Stock Prices

Best and Worst Stock Performers

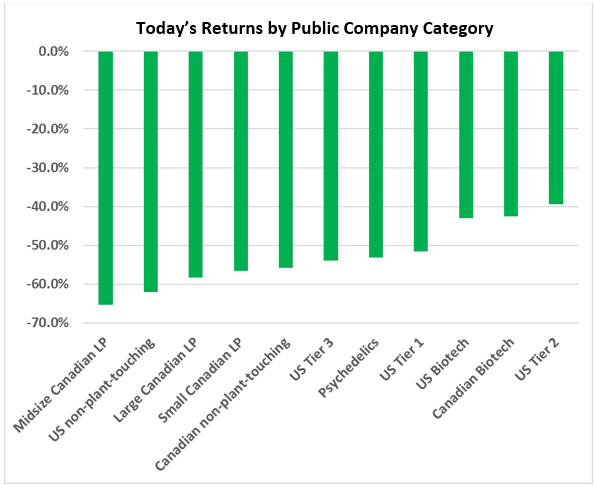
YTD Returns by Public Company Category

  • U.S. Tier 1 companies improved several notches in response to the surprise Biden announcement. Canadian LPs have significantly underperformed the other categories.

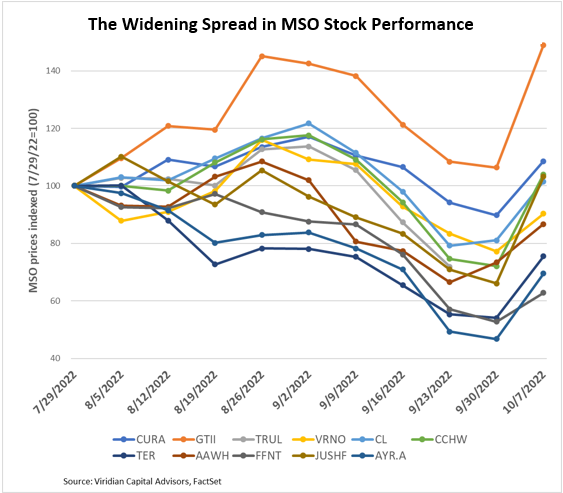
  • The market is strongly differentiating between MSOs. In two months, there has been a 60-point difference between the percentage returns of the best-performing versus the worst-performing MSO. The chart below shows the divergence of stock prices since the end of July.

 Best and Worst Performers of the last week and YTD

  • Jushi Inc. (JUSHF: OTC) was the week’s best performer, up 56.1%. The market-beating performance was a bit puzzling since the company focuses on eastern limited license states, which are not the locations that would gain the most from rescheduling or de-scheduling.
  • Glass House (GLASF: OTC), up 49.6% for the week, is more understandable. It is arguably the best-positioned company for an interstate commerce scenario.
  • The worst performer was TPCO, down 18.9%. We saw no news to explain the move.


This Chart is Only Available to Higher Tier Memberships

Please Purchase a Basic, Premium, or Enterprise membership to see more.

This Chart is Only Available to Higher Tier Memberships

Please Purchase a Basic, Premium, or Enterprise membership to see more.

Please login to your account to view data charts.