OUR 9TH YEAR OF PROVIDING PROPRIETARY CAPITAL MARKETS INTELLIGENCE ON THE CANNABIS / HEMP / PSYCHEDELIC SECTORS

Capital Raises

Past Charts

Capital Raises

Capital Raises Summary

Each week, Viridian publishes insights and analysis on completed capital raise transactions in the prior week, focusing on all equity and debt deals. Our analysis includes:

  • Summary
  • Outlook
  • Best & Worst Perfromers

Quick Links

YTD Analysis

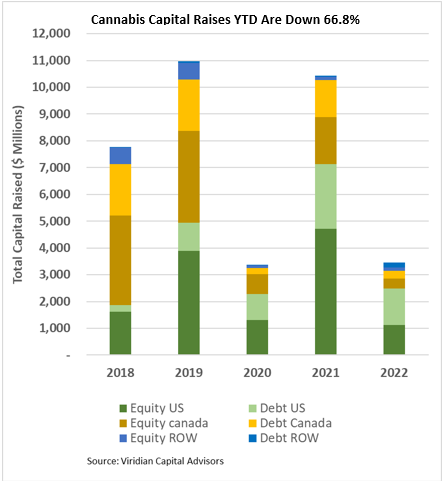
Cannabis capital raises are off 66.8% YTD:

  • Total Equity issuance is off 75.6%, and total debt issuance is down 51.4%.
  • U.S. debt is down only 42.9%, while Canadian debt is down a more significant 78.7%.
  • At 53.4% of total capital raised, debt remains the highest in history for comparable periods.
  • Public companies accounted for 73.6% of total financing YTD, down from 78.9% in 2021.
  • The graph below shows that U.S. activity dominated capital raises for the first forty-two weeks of 2022, with 55.1% of all capital raised.

Market Commentary and Outlook

  • Cannabis stock prices (measured by the MSOS ETF) were up 16.02% last week, closing to 7% of their recent highs while still 57% down for the year.
  • The near-term market importance of Biden’s announcement boils down to the impact it might have on SAFE+ legislation, which remains the only actionable piece of legislation, in our opinion. We think the chances for SAFE+ are helped by the federal pardons and Biden’s urging the states to follow through on additional expungement measures.
  • We believe that SAFE+ will likely have dramatic, though indirect, impacts on stock prices.   Giving banks safe harbor to deal with cannabis companies is likely to lead to increased bank custodial services for cannabis stocks, which we think will eventually lead to greater trading liquidity, a broader investor base, and uplisting.
  • The merest hint that the Fed might moderate the pace of rate increases has set equity markets on fire. We think the market’s focus on the fed funds rate is misplaced. Ongoing quantitative tightening is where the real work of the Fed is happening, draining the massive pool of excess money supply that has been washing through the financial system for years. And make no mistake, QT is not good for asset prices. Meanwhile, the news cycle borders on bizarre: chaos in British politics and economics, threats of dirty bombs in Ukraine, a crackdown in Chinese politics, and back-to-back multi-hundred-point runs in the major indexes.
  • Meanwhile, negative industry trends and a tight capital market are pressuring middle and lower-tier cannabis companies. Restructuring news is front and center like we haven’t seen since 2020. These pressures are likely to drive accelerating industry consolidation.
  • Today’s announcement of forming a US holding company for Canopy Growth’s US assets gives us that “what do they know that we don’t know” feeling. Hiding behind the veil of ownership without voting control seems like a thin reed to maintaining primary exchange listing. Still, Canopy evidently ran this idea past the exchanges and got it pre-approved. It raises the question of whether US MSOs could use the same maneuver as a path to up-listing.  In the end, we have to give credit to Canopy for its legal inventiveness. How different the cannabis world might be if Canopy’s business strategists were as sharp as its lawyers!

This Week Sector Focus

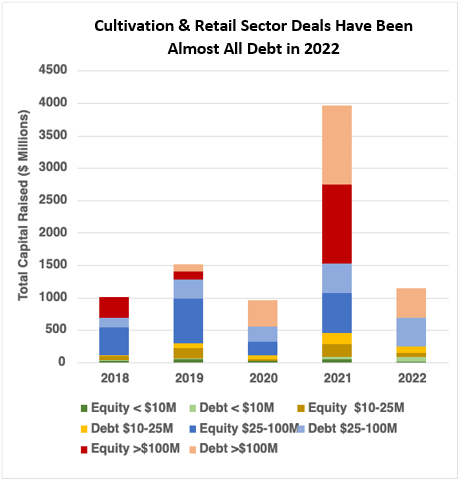
The U.S. Cultivation & Retail sector has experienced a sharper change in capital raise activity:

  • Total capital raised is down 69.9%, but equity capital raised is down approximately 96%.
  • Debt financing is down 39.5% YTD and accounts for about 93% of all capital raised; private companies raised a record 36% of it.
  • 64% of total capital raises YTD were completed by public companies compared to 78.9% in 2021.
  • In 2022, there have been no equity deals above $25M, which has never happened in a comparable period.

Capital Raises vs Stock Prices

Best and Worst Stock Performers

YTD Returns by Public Company Category

  • What a difference a week can make! U.S. tier-one MSOs lost four places in our ranking of YTD stock performance in a dramatic demonstration that liquidity can cut both ways. U.S. Biotech and Psychedelics were two of the gainers.


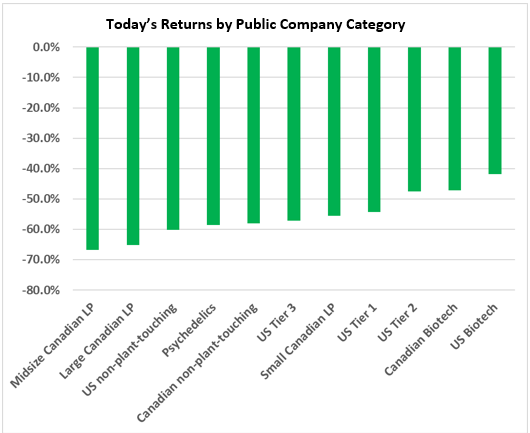
  • The market is still strongly differentiating between MSOs, and the gap in the last twelve-week stock performance between the best performer (GTI (GTII: CSE) up 26.9%) and the worst (TerrAscend (TER: CSE) down 32.2%) has widened to 59 points.


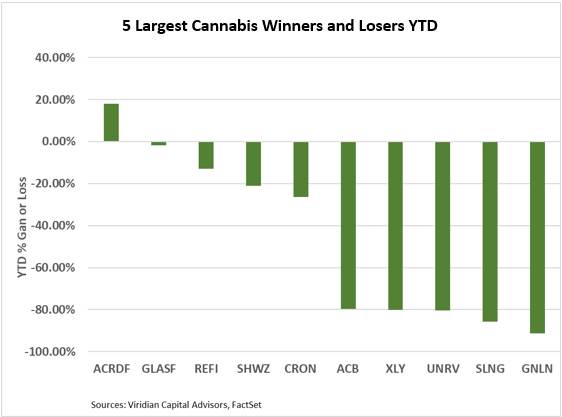
Best and Worst Performers of the last week and YTD

  • California-based Unrivaled (UNRV: OTC) and Glass House (GLASF: OTC) repeated their performance among the week’s top cannabis stocks.
  • AYR Wellness (AYR.A: CSE) has been one of the top ten performers for three weeks. The company had become too cheap for investors to ignore and is also a potential takeout candidate.
  • Two companies on the loser list this week, Tilt (TILT: CSE) and StateHouse (STHZ: CSE), also appeared on our Chart of the Week screening for companies with low liquidity and high market leverage ratios.


This Chart is Only Available to Higher Tier Memberships

Please Purchase a Basic, Premium, or Enterprise membership to see more.

This Chart is Only Available to Higher Tier Memberships

Please Purchase a Basic, Premium, or Enterprise membership to see more.

Please login to your account to view data charts.