OUR 9TH YEAR OF PROVIDING PROPRIETARY CAPITAL MARKETS INTELLIGENCE ON THE CANNABIS / HEMP / PSYCHEDELIC SECTORS

Capital Raises

Past Charts

Capital Raises

Capital Raises Summary

Each week, Viridian publishes insights and analysis on completed capital raise transactions in the prior week, focusing on all equity and debt deals. Our analysis includes:

  • Summary
  • Outlook
  • Best & Worst Perfromers

Quick Links

YTD Analysis

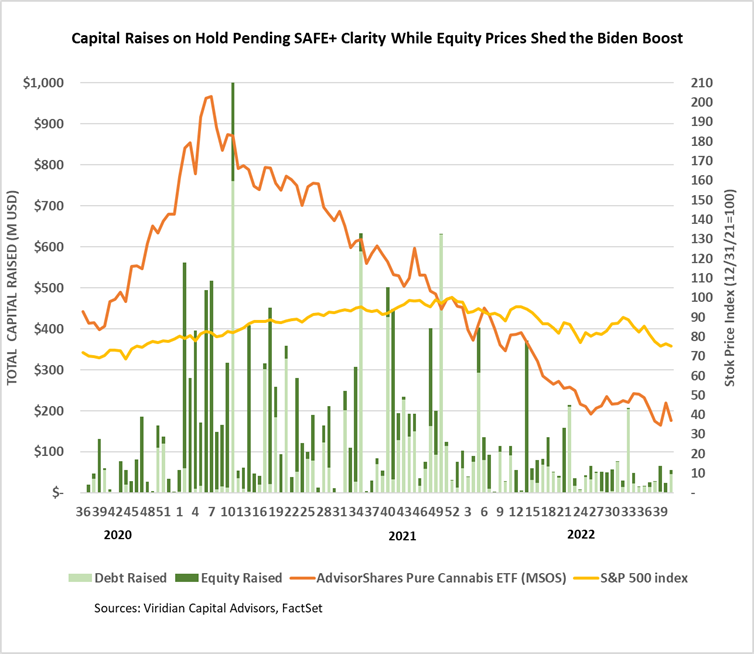
Cannabis capital raises are off 66.4% YTD:

  • Total Equity issuance is off 75.8%, and total debt issuance is down 49.7%.
  • U.S. debt is down only 39.9%, while Canadian debt is down a more significant 78.5%.
  • At 53.7% of total capital raised, debt remains the highest in history for comparable periods.
  • Public companies accounted for 73.9% of total financing YTD, down from 83.2% in 2021.
  • The graph below shows that U.S. activity dominated capital raises for the first forty-one weeks of 2022, with 71.8% of all capital raised.

Market Commentary and Outlook

  • Cannabis stock prices (measured by the MSOS ETF) were down by 19.6% last week, giving back about 2/3 of the “Biden Bump.”
  • The near-term market importance of Biden’s announcement boils down to the impact it might have on SAFE+ legislation, which remains the only actionable piece of legislation, in our opinion. We think the chances for SAFE+ are helped by the federal pardons and Biden’s urging the states to follow through on additional expungement measures.
  • We believe that SAFE+ will likely have dramatic, though indirect,  impacts on stock prices.   Giving banks safe harbor to deal with cannabis companies is likely to lead to increased bank custodial services for cannabis stocks, which we think will eventually lead to greater trading liquidity, a broader investor base, and uplisting.
  • The failure of modest gains to stick conveys a continued market skepticism about Washington’s ability to push through even modest banking reform, let alone full legalization.
  • The macro-environment remains perilous, and recent job market strength appears to quash the likelihood of a near-term Fed pivot. We believe there is a high likelihood of a recession in 2023, and most economists now agree with us.
  • Meanwhile, the negative industry trends of commodification-driven wholesale price declines, margins weakened by inflation, and pressured consumers, continue unabated.
  • These pressures are likely to drive accelerating industry consolidation. Our chart of the week showed two relatively large MSOs, Jushi (JUSHF: CSE) and AYR (AYR.A: CSE), with significant debt maturities that need to be refinanced, potentially hindering their ability to attract growth capital. Ascend’s (AAWH: CSE) former CEO is on record stating that the company is not large enough to be competitive long-term and must be considered an acquisition target. Goodness Growth (GDNS: CSE), left at the altar by Verano, and suffering a severe stock pounding, is clearly in the target group, but unfortunately, its crown jewel New York, has become increasingly tarnished. We think industry consolidation is virtually inevitable, with or without SAFE, and the bill’s failure might accelerate the pace.

This Week Sector Focus

The U.S. Cultivation & Retail sector has experienced a sharper change in capital raise activity:

  • Total capital raised is down 69.9%, but equity capital raised is down approximately 96%.
  • Debt financing is down 39.5% YTD and accounts for about 93% of all capital raised; private companies raised a record 36% of it.
  • 64.0% of total capital raises YTD were completed by public companies compared to 78.9% in 2021.
  • In 2022, there have been no equity deals above $25M, which has never happened in a comparable period.

Capital Raises vs Stock Prices

Best and Worst Stock Performers

YTD Returns by Public Company Category

  • What a difference a week can make! U.S. tier-one MSOs lost four places in our ranking of YTD stock performance in a dramatic demonstration that liquidity can cut both ways. U.S. Biotech and Psychedelics were two of the gainers.

  • The market is still strongly differentiating between MSOs, but the record-high gap of 86 points last week has narrowed to only 45 points. The chart below shows the divergence of stock prices since the end of July.

 Best and Worst Performers of the last week and YTD

  • Three of the top ten performers this week are California based: StateHouse (STHZ: OTC), Unrivaled (UNRV: OTC), and Glass House (GLASF: OTC), possibly on news that California is becoming more aggressive in fighting the illicit market.
  • AYR Wellness (AYR.A: CSE) has now been one of the top ten performers for two weeks. The company had become too cheap for investors to ignore and is also a potential take out candidate.
  • Aside from Goodness Growth (GDNS: CSE), down 58.9% after being jilted by Verano (VRNO: CSE), Canadian companies, including Canopy (WEED: TSX), Aurora (ACB: TSX) and Sundial (SNDL: Nasdaq) were prominently featured in the loser list.


This Chart is Only Available to Higher Tier Memberships

Please Purchase a Basic, Premium, or Enterprise membership to see more.

This Chart is Only Available to Higher Tier Memberships

Please Purchase a Basic, Premium, or Enterprise membership to see more.

Please login to your account to view data charts.