Each week, Viridian publishes insights and analysis on completed capital raise transactions in the prior week, focusing on all equity and debt deals. Our analysis includes:
- Summary
- Outlook
- Best & Worst Perfromers
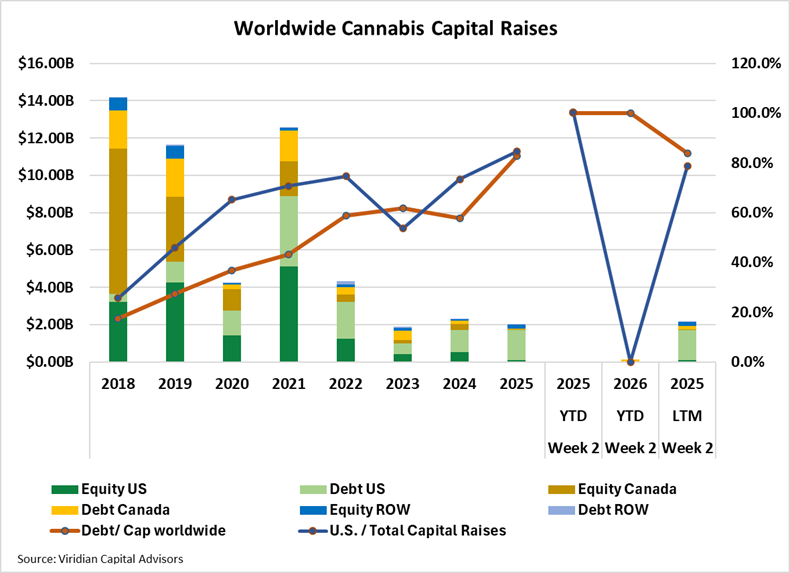
- From an LTM view, capital raises totaled $2.16B, down 7.0% from the same period in 2025. Debt as a percentage of capital raised worldwide is 83.8%, compared to 57.8% in the previous year. U.S. raises LTM accounted for 78.7% of total funds, down from 84.6% in 2025. Raises from outside Canada and the U.S. accounted for 10.4% of total funds raised, almost double the average of 5.3% over the six previous years.
- Public company raises accounted for 93.1% of total raises in the LTM period, the highest in at least the last 7 years.
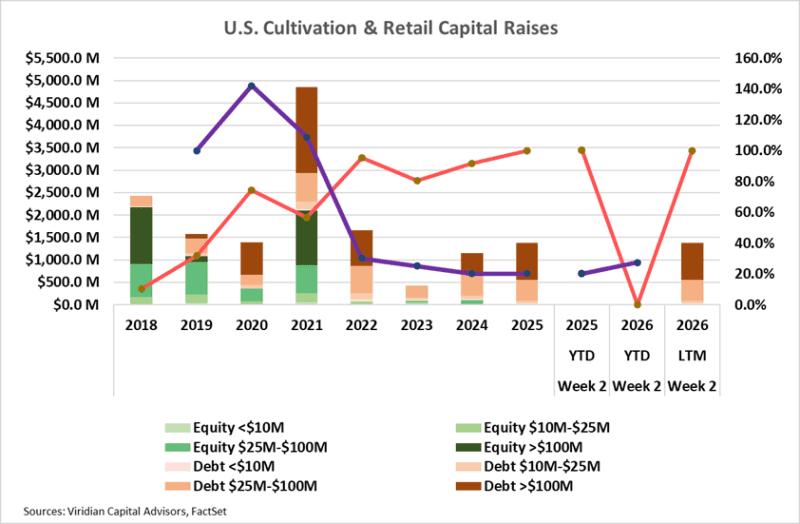
- For the LTM period, the capital raised in the cultivation and retail sector was $1.37B, 18.5% higher than in 2024, which in turn was 160% higher than in 2023.
- Debt accounts for a whopping 99.7% of the funds raised over the last 12 months (LTM). Large debt issues (over $100M) accounted for 59.3% of capital raised, up from 0% in 2023.
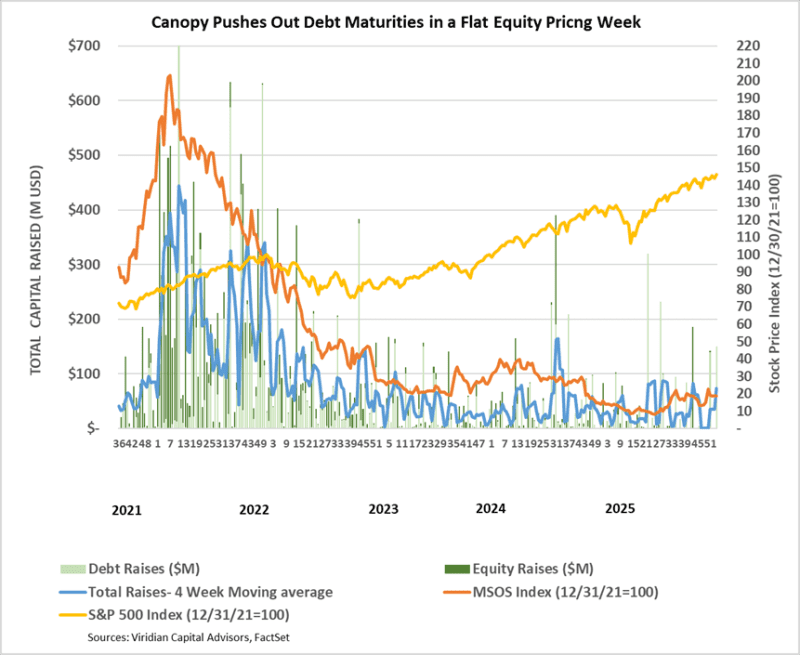
- Cannabis equity prices (as measured by the MSOS ETF) fell by 0.8%
- Cannabis equity prices (as measured by the MSOS ETF) fell by 0.8%
