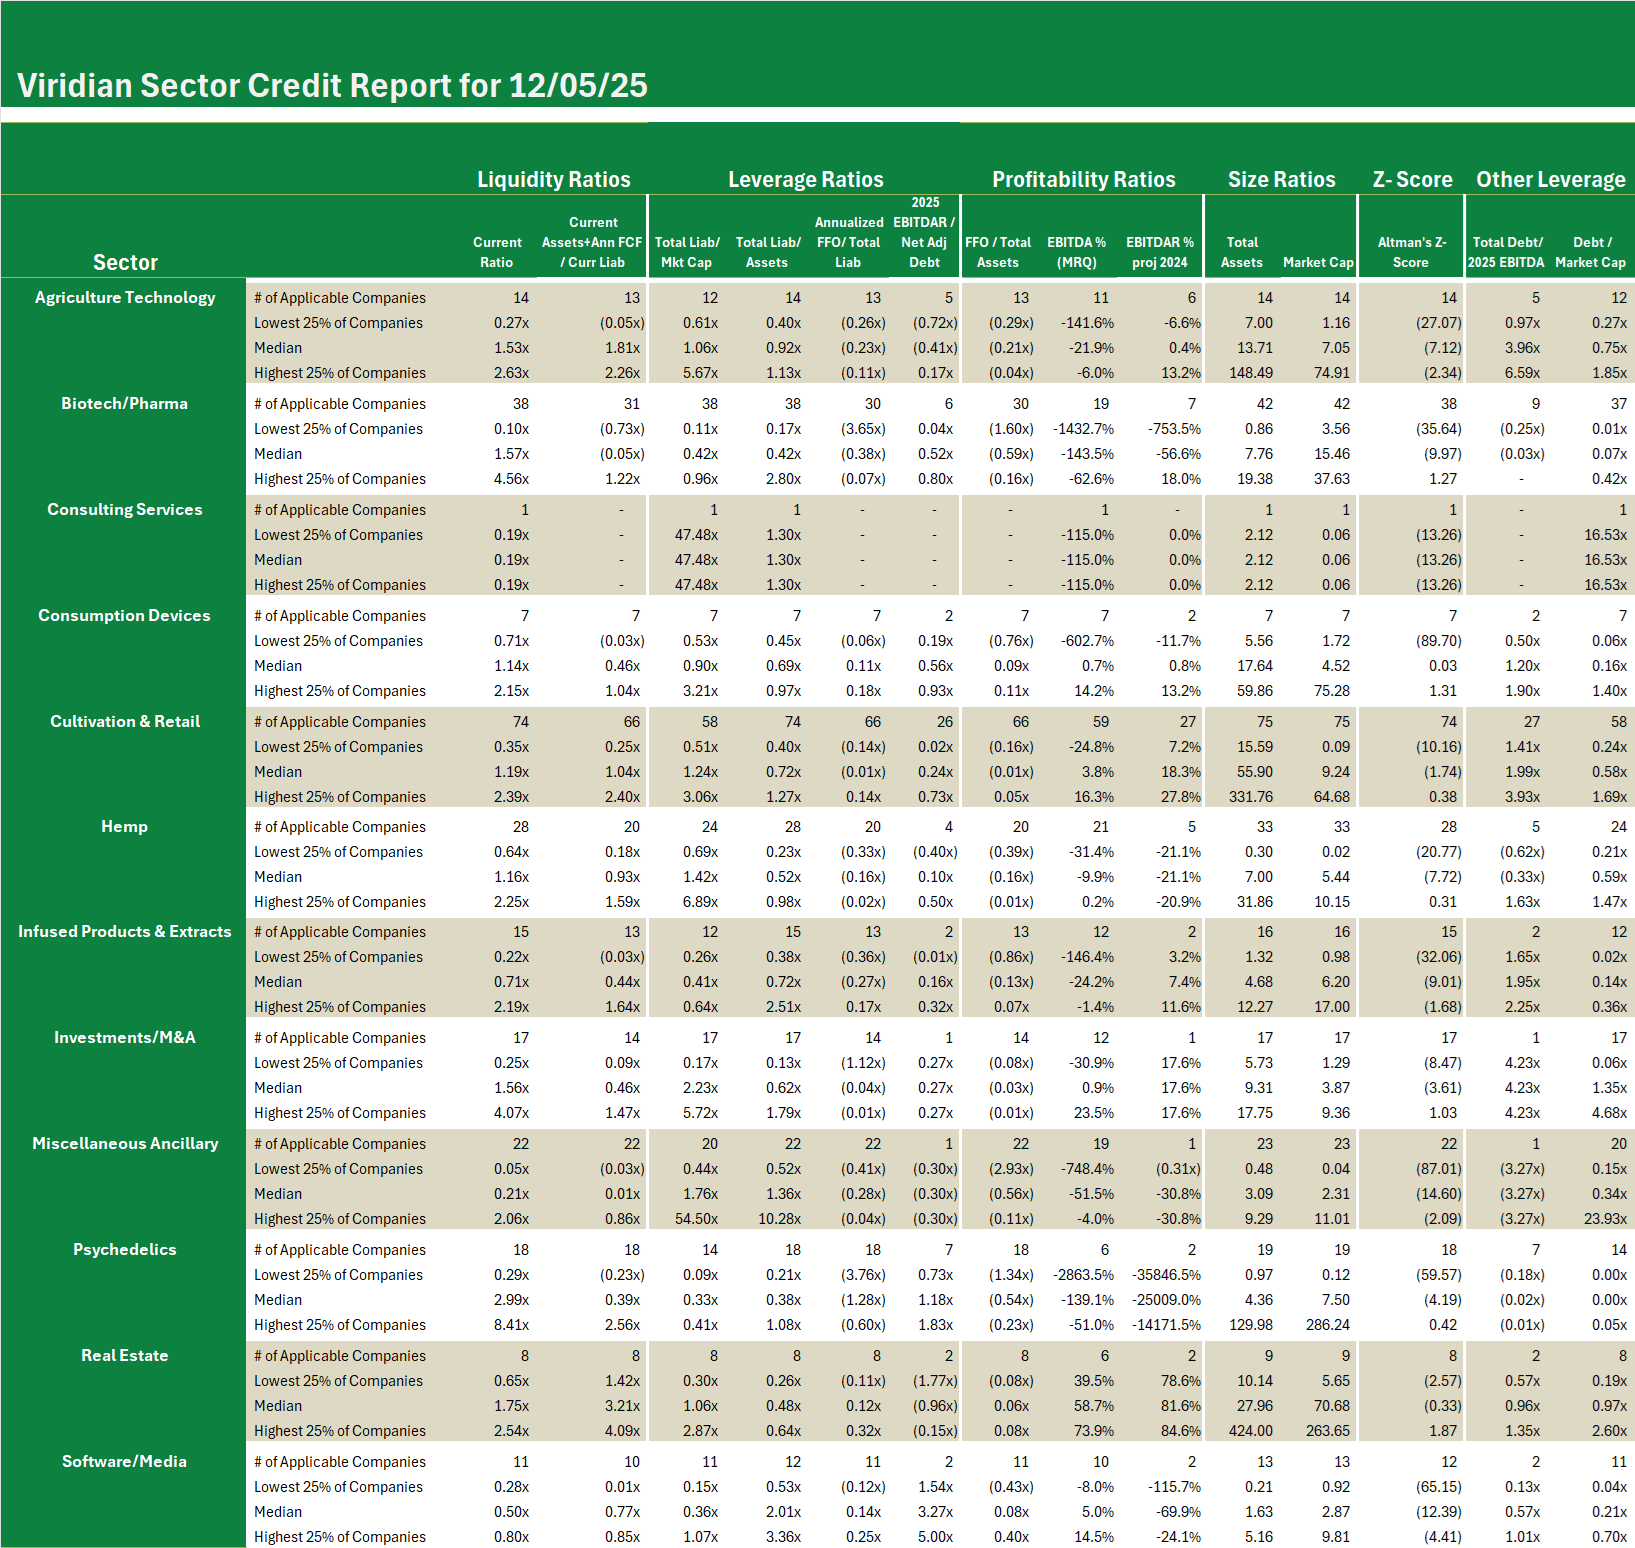
Credit ratings are not currently available for public cannabis companies leaving companies, lenders and investors with a gap of information. The Viridian Cannabis Credit Tracker fills this gap. The model uses 11 market and financial statement variables to discern 4 key credit factors: Liquidity, Leverage, Profitability, and Size, to provide credit/liquidity analysis for over 370 public Cannabis/Hemp companies.
Weekly Credit Report – U.S. Cultivation and Retail Companies with Market Caps between $25M and $100M – Summary statistics and ranking
-
-
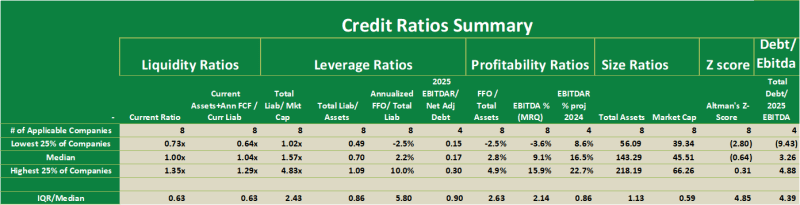
- The Viridian Weekly Credit report investigated credit metrics and the Viridian Credit Rankings of the eight public U.S. Cultivation & Retail Companies with market caps between $25M and $100M
- The top table shows the summary statistics by quartiles.
- Note that the median free cash flow adjusted current ratio is now 1.04x, indicating that more than one half of the group can satisfy their current liabilities without new financing or asset sales. Jushi, Planet 13, Leef Brands, and iAnthus all fall below 1x on this ratio indicating a need for additional financing
- The median total liabilities to market cap is 1.57x, well below the warning level of 5x which tends to indicate an asset value coverage of liabilities of less than 1x. Two companies hit this first warning level: Jushi and iAnthus. Both of these companies also have significant 2026 debt maturities. Jushi, however, benefits from strong positioning in Pennsylvania and Virginia, two markets with strong potential to flip to adult use.
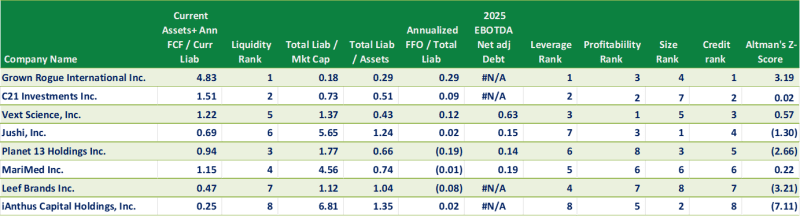
- Grown Rogue ranks as the best overall credit in this group, with #1 rankings in both liquidity and leverage, the highest weighted two factors in the Viridian model.
- iAnthus ranks as the worst credit in the group based on its #8 ranking in both liquidity and leverage, which is not made up for enough by its #2 size ranking.
-
Credit ratings are not currently available for public cannabis companies leaving companies, lenders and investors with a gap of information. The Viridian Cannabis Credit Tracker fills this gap. The model uses 11 market and financial statement variables to discern 4 key credit factors: Liquidity, Leverage, Profitability, and Size, to provide credit/liquidity analysis for over 370 public Cannabis/Hemp companies.
Weekly Sector Credit – Cultivation and Retail Sector
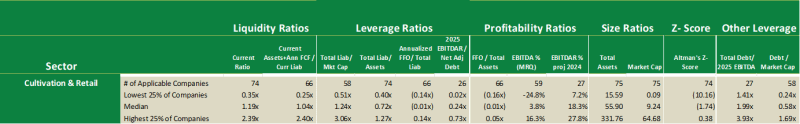
- The chart below shows the credit metrics for the Cultivation and Retail sector.
-
- The median free cash flow adjusted current ratio for the 74 Cultivation & Retail companies in the Viridian credit tracker database is 1.15x, slightly better than the level we measured for the medium-sized U.S. operators profiled above.
- Similarly, the total liabilities to market cap median of 1.24x is better than the medium sized U.S. group
- The biggest difference between the larger Cultivation & Retail group shows up in the total debt/ 2025 EBITDA measure, where the larger group drastically outperforms the smaller U.S. portion with debt/EBITDA of 1.99x vs 3.26x. This coincides with our earlier finding that Canadian companies tend to be less levered than their U.S. counterparts
Weekly Sector Credit – Cultivation and Retail Sector
- The chart below shows the credit metrics for the Cultivation and Retail sector.
-
- The median free cash flow adjusted current ratio for the 74 Cultivation & Retail companies in the Viridian credit tracker database is 1.15x, slightly better than the level we measured for the medium-sized U.S. operators profiled above.
- Similarly, the total liabilities to market cap median of 1.24x is better than the medium sized U.S. group
- The biggest difference between the larger Cultivation & Retail group shows up in the total debt/ 2025 EBITDA measure, where the larger group drastically outperforms the smaller U.S. portion with debt/EBITDA of 1.99x vs 3.26x. This coincides with our earlier finding that Canadian companies tend to be less levered than their U.S. counterparts