Viridian highlights a specific industry sector and provides a deep dive into valuation metrics and comparable company valuations for public companies operating in that sector. The Weekly Valuation Tracker provides proprietary, actionable valuation data.
Weekly Valuation Report – Cultivation & Retail as of 12/12/25
-
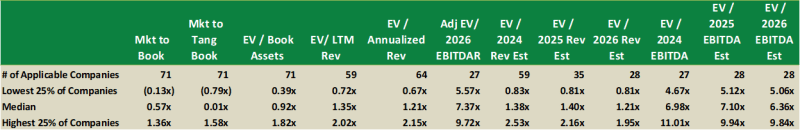
- The table below shows the summary valuation metrics for the 71 cultivation & retail companies in the Viridian Value Tracker database.
-
- Note that of the 28 companies with sell-side analyst coverage, the median EV/2026 EBITDA is still only 6.36x, leaving substantial room to run as the rescheduling news is further digested and timing becomes a bit clearer. The third quartile EBITDA multiple of 9.84x indicates that 25% of the companies (7) have EBITDA multiples above that value.
- Looking over the history since 2022, we find a reasonable likelihood that U.S. multiples could rise to over 12x.
- EV/2026 Revenue multiples have a median value of 1.21x and a third quartile value of 1.95x
The Viridian Value Tracker is the most comprehensive valuation product in the industry.
-
- A broad set of 12 valuation measures assures applicability, regardless of whether the company has analyst coverage or revenues. The typically presented EV/ Projected Revenues and EV/ Projected EBITDA are available for less than 1/3 of the cannabis companies we track.
- Most valuation studies present only the average valuation measures, while the Tracker goes one step further and shows the distribution of values (the quartiles, median, and dispersion) for each measure. This gives users a more complete view of how companies in the cohort group are valued.
Sector Valuation Report – Trump’s Rescheduling Announcement – A Watershed Event for Cannabis
Today, President Trump announced historic changes in federal cannabis policy:
-
- Rescheduling
- Directs the Attorney General to complete the rulemaking to move marijuana from Schedule I to Schedule III under the Controlled Substances Act.
- Anchors the action to the 2023 HHS recommendation, recognizing accepted medical use.
- Emphasizes expedited completion within existing law.
- Medical use recognition
- Explicitly acknowledges that medical marijuana has accepted medical uses.
- Cites FDA findings supporting use for pain, nausea and vomiting, and anorexia related to medical conditions.
- References widespread state-level medical programs and millions of registered patients.
- Research expansion
- Prioritizes expansion of medical marijuana research.
- Calls for real-world evidence and practical clinical models.
- Focuses on safety, efficacy, dosing, and long-term effects.
- Highlights gaps in physician guidance and patient disclosure.
- CBD and hemp-derived products
- Addresses regulatory gaps for hemp-derived cannabinoids, especially CBD.
- Directs work with Congress to update definitions affecting full-spectrum CBD.
- Seeks clearer federal standards, more accurate labeling, and stronger consumer safeguards.
- Contemplates THC per-serving and per-container limits.
- Public health framing
- Positions the action as improving care for chronic pain patients, seniors, and veterans.
- Notes potential opioid-reduction effects among medical marijuana users.
- Emphasizes risk management for seniors and polypharmacy patients.
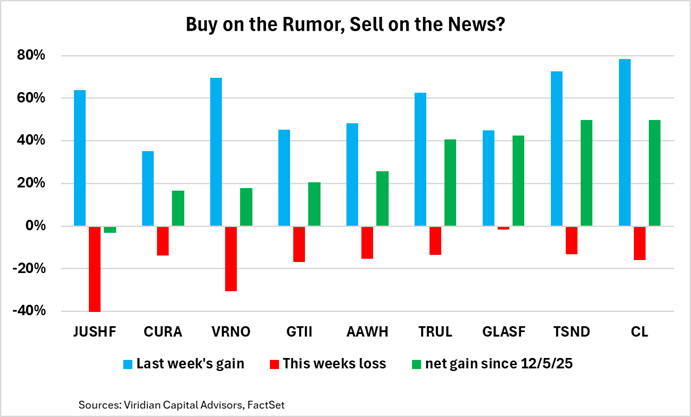
- Paradoxically, the cannabis stock market was down sharply on the news. The chart below shows the percentage increase in prices during the week ended 12/12/25 (blue bars), the percent decline from 12/12/25 to 12/18/25 (red bars), and the resulting net gain over the period (green bars)
- Note that despite today’s sharp reversal, all stocks except Jushi are up over the full period.
- Rescheduling
-
- But why the sharp reversal today on ostensibly the best news cannabis has had in many years?
- One explanation can be summarized by the old Wall Street adage, “Buy on the Rumor, Sell on the News.” The rescheduling announcement had been priced in over the last week, and there was little surprise when it finally happened. Retail traders may have been anxious to harvest the only significant gains they had seen in their cannabis portfolios.
- Today’s announcement did not reschedule cannabis. There was no final rule. Instead, he instructed Bondi to proceed as rapidly as feasible toward rescheduling. Observers who expected a final ruling may have been disappointed.
- There had been several rumors circulating that the executive order would include provisions on SAFE banking, but it did not.
- Finally, the positive comments directed toward hemp-based cannabinoids may have thrown a life raft to the hemp industry, and that may be unpopular in some legal cannabis circles.
- We believe that further price gains will occur as the timing and details of the process become clearer.
- But why the sharp reversal today on ostensibly the best news cannabis has had in many years?
Sector Valuation Report – Trump’s Rescheduling Announcement – A Watershed Event for Cannabis
Today, President Trump announced historic changes in federal cannabis policy:
-
- Rescheduling
- Directs the Attorney General to complete the rulemaking to move marijuana from Schedule I to Schedule III under the Controlled Substances Act.
- Anchors the action to the 2023 HHS recommendation, recognizing accepted medical use.
- Emphasizes expedited completion within existing law.
- Medical use recognition
- Explicitly acknowledges that medical marijuana has accepted medical uses.
- Cites FDA findings supporting use for pain, nausea and vomiting, and anorexia related to medical conditions.
- References widespread state-level medical programs and millions of registered patients.
- Research expansion
- Prioritizes expansion of medical marijuana research.
- Calls for real-world evidence and practical clinical models.
- Focuses on safety, efficacy, dosing, and long-term effects.
- Highlights gaps in physician guidance and patient disclosure.
- CBD and hemp-derived products
- Addresses regulatory gaps for hemp-derived cannabinoids, especially CBD.
- Directs work with Congress to update definitions affecting full-spectrum CBD.
- Seeks clearer federal standards, more accurate labeling, and stronger consumer safeguards.
- Contemplates THC per-serving and per-container limits.
- Public health framing
- Positions the action as improving care for chronic pain patients, seniors, and veterans.
- Notes potential opioid-reduction effects among medical marijuana users.
- Emphasizes risk management for seniors and polypharmacy patients.
- Paradoxically, the cannabis stock market was down sharply on the news. The chart below shows the percentage increase in prices during the week ended 12/12/25 (blue bars), the percent decline from 12/12/25 to 12/18/25 (red bars), and the resulting net gain over the period (green bars)
- Note that despite today’s sharp reversal, all stocks except Jushi are up over the full period.
- Rescheduling
-
- But why the sharp reversal today on ostensibly the best news cannabis has had in many years?
- One explanation can be summarized by the old Wall Street adage, “Buy on the Rumor, Sell on the News.” The rescheduling announcement had been priced in over the last week, and there was little surprise when it finally happened. Retail traders may have been anxious to harvest the only significant gains they had seen in their cannabis portfolios.
- Today’s announcement did not reschedule cannabis. There was no final rule. Instead, he instructed Bondi to proceed as rapidly as feasible toward rescheduling. Observers who expected a final ruling may have been disappointed.
- There had been several rumors circulating that the executive order would include provisions on SAFE banking, but it did not.
- Finally, the positive comments directed toward hemp-based cannabinoids may have thrown a life raft to the hemp industry, and that may be unpopular in some legal cannabis circles.
- We believe that further price gains will occur as the timing and details of the process become clearer.
- But why the sharp reversal today on ostensibly the best news cannabis has had in many years?