OUR 9TH YEAR OF PROVIDING PROPRIETARY CAPITAL MARKETS INTELLIGENCE ON THE CANNABIS / HEMP / PSYCHEDELIC SECTORS
Credit ratings are not currently available for public cannabis companies leaving companies, lenders and investors with a gap of information. The Viridian Cannabis Credit Tracker fills this gap. The model uses 11 market and financial statement variables to discern 4 key credit factors: Liquidity, Leverage, Profitability, and Size, to provide credit/liquidity analysis for over 370 public Cannabis/Hemp companies.
Weekly Sector Credit – Cultivation and Retail
-
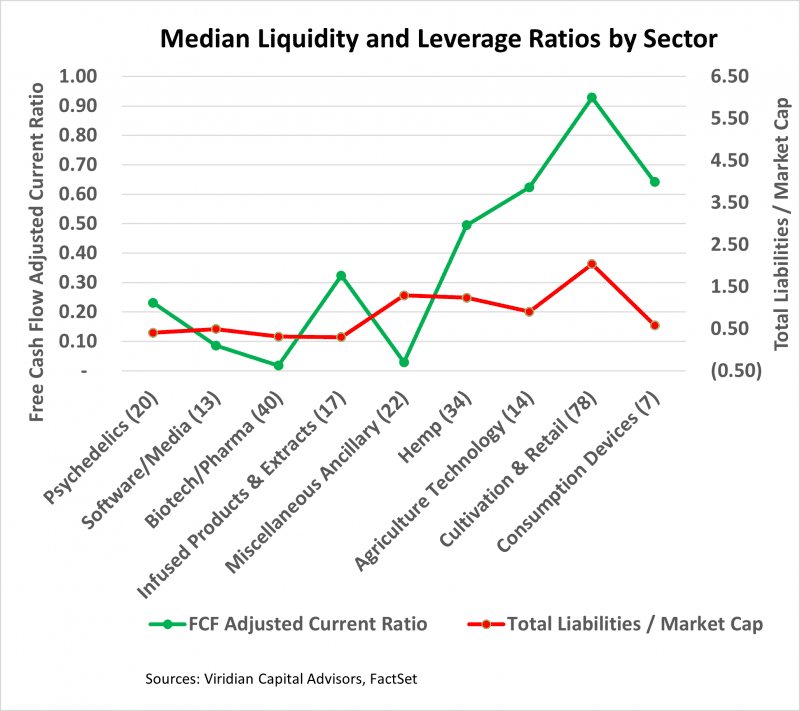
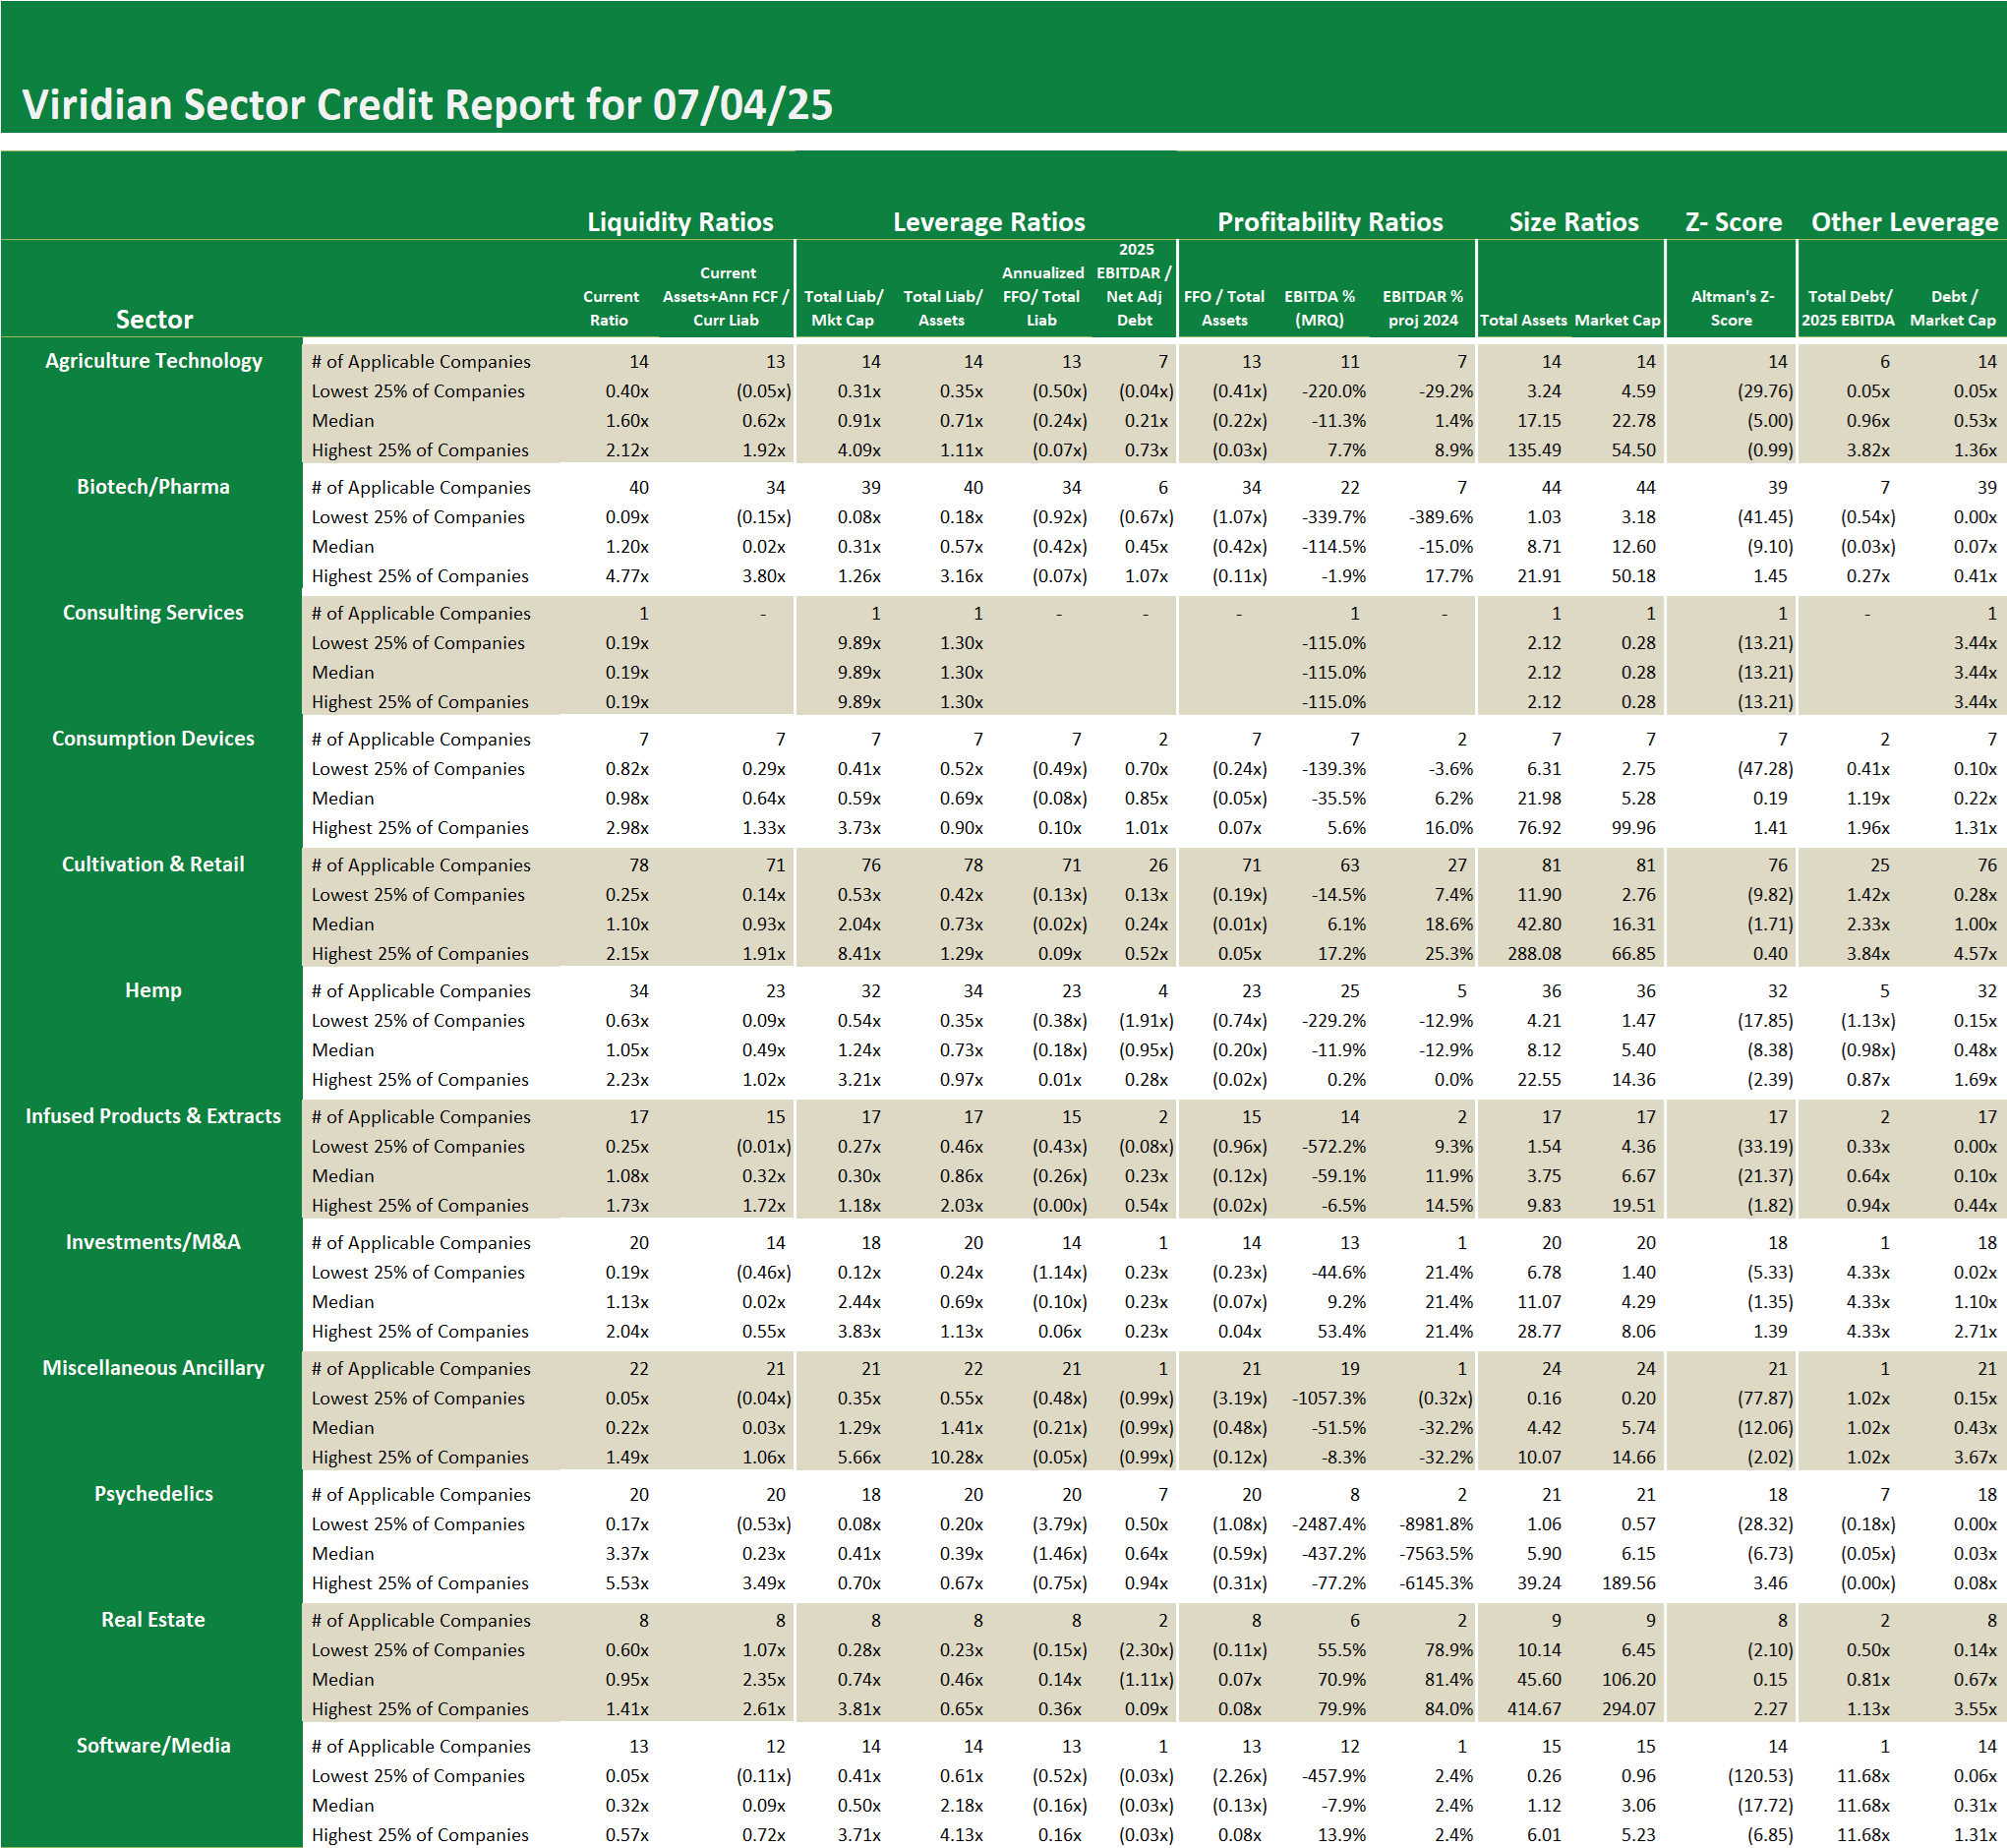
- We have shifted the focus of our Debt/EBITDA credit ratios to projected 2026 results rather than 2025. Median Debt to 2026 EBITDA is 2.33x as of 7/4/25, up from 2.07x last week. This figure continues to show that around ½ of the companies have sustainable leverage even in a continuing 280E environment.
- The total liabilities to market cap ratio also deteriorated to 2.04x compared to 1.95x last week. Still, the 2.04x median indicates that over 50% of the sector has asset value coverage of liabilities in excess of 135%.
- Liquidity remains the Achilles heel of the sector. The free cash flow-adjusted current ratio dropped to 0.93x this week, compared to 1.01x last week, suggesting that over 50% of the sector’s participants will require additional funding to discharge their short-term liabilities. Not the best position to be in when the capital markets remain tight.
- See the Viridian Credit Sector Report for more details.
Weekly Sector Credit – Cultivation and Retail
-
- We have shifted the focus of our Debt/EBITDA credit ratios to projected 2026 results rather than 2025. Median Debt to 2026 EBITDA is 2.33x as of 7/4/25, up from 2.07x last week. This figure continues to show that around ½ of the companies have sustainable leverage even in a continuing 280E environment.
- The total liabilities to market cap ratio also deteriorated to 2.04x compared to 1.95x last week. Still, the 2.04x median indicates that over 50% of the sector has asset value coverage of liabilities in excess of 135%.
- Liquidity remains the Achilles heel of the sector. The free cash flow-adjusted current ratio dropped to 0.93x this week, compared to 1.01x last week, suggesting that over 50% of the sector’s participants will require additional funding to discharge their short-term liabilities. Not the best position to be in when the capital markets remain tight.
- See the Viridian Credit Sector Report for more details.