OUR 9TH YEAR OF PROVIDING PROPRIETARY CAPITAL MARKETS INTELLIGENCE ON THE CANNABIS / HEMP / PSYCHEDELIC SECTORS
Quick
Links
Past Charts
Home » Viridian Capital Chart of the Week: Which Margins Should Investors Focus On?
Chart of the Week
Chart of the Week
The Viridian Capital Chart of the Week highlights key investment, valuation and M&A trends taken from that week’s Deal Tracker that we believe are impactful for investors, companies and acquirers.
Week ended 07/12/2024
Viridian Capital Chart of the Week: Which Margins Should Investors Focus On?
-
- Viridian’s Chart of the Week focuses on the strengths and weaknesses of different margins as a measure of profitability and credit quality.
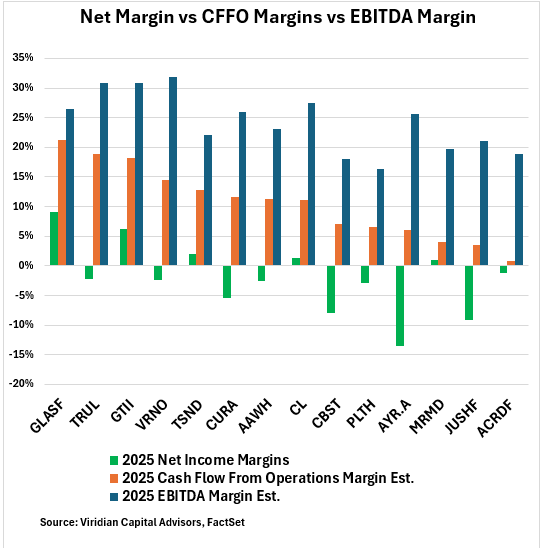
- The green line in the graph shows consensus estimates of 2025 net margins; the red line shows 2025 cash flow from operations margins, while the blue line shows consensus estimates of 2025 EBITDA Margins. The chart is arranged to show companies with the highest projected Cash Flow margins on the left.
- Note that in every case, the net margin is lower than the cash flow from operations margin, which, in turn, is lower than the EBITDA margin. Why are these measures so different, and which should be paid most attention to? The obvious, although frustrating, answer is that it depends on the use.
- Net margins are rarely discussed in cannabis, and a quick look at the graph shows why. Nine of the seventeen companies have negative net income estimates for 2025. The chief culprit is, of course, 280e taxes, and several of these companies are also overleveraged with relatively expensive debt dragging down net income. The main advantage is the matching principle of accounting. When a company buys inventory, it is not counted as an expense since it has not yet sold the product. Similarly fixed assets are expensed over time in keeping with their useful life. One significant disadvantage of net income, however, is that management choices can manipulate it. A company that changes inventory accounting methods or fixed useful life estimates for fixed assets will change its net income. Similarly, management has a wide range of choices on how to accrue expenses, all of which impact net income.
- Operating Cash Flow Margins have one huge benefit – they are the most difficult to manipulate. Most changes in accounting policies leave cash flow unchanged. Operating cash flow is where analysts should focus on determining debt capacity and ability to fund operations internally. Weaknesses included the fact that if one stretches payables or purchases insufficient income, both will temporarily at least increase operating cash flow.
- EBITDA is one of the best measures of the overall earnings power for all stakeholders. EBITDA multiples are often used to value companies using comparable company values. However, one must be aware of the implicit assumptions being made. One is that the companies being compared have similar tax structures. This is obviously invalid when comparing U.S. Cannabis companies to Canadian LPs or other CPG sectors. All other things being equal, U.S. MSOs should carry lower EBITDA multiples since more of it must go to taxes. Another implicit assumption is that the comparison groups all have similar CAPEX requirements. If they don’t, then EBITDA distorts a critical aspect of discounted cash flow valuation. Still, if investors are mindful of the implicit assumptions, EBITDA can be a helpful valuation tool, although its use in credit analysis is more mixed.
- Investors can be creatures of habit, reaching for the same tools for every use. Each of the multiples discussed should be calculated and weighed to form consistent and accurate valuation and credit judgments. Investors need to be aware of the assumptions they are making with too much emphasis on one of these measures.