Each week, Viridian publishes insights and analysis on completed capital raise transactions in the prior week, focusing on all equity and debt deals. Our analysis includes:
- Summary
- Outlook
- Best & Worst Perfromers
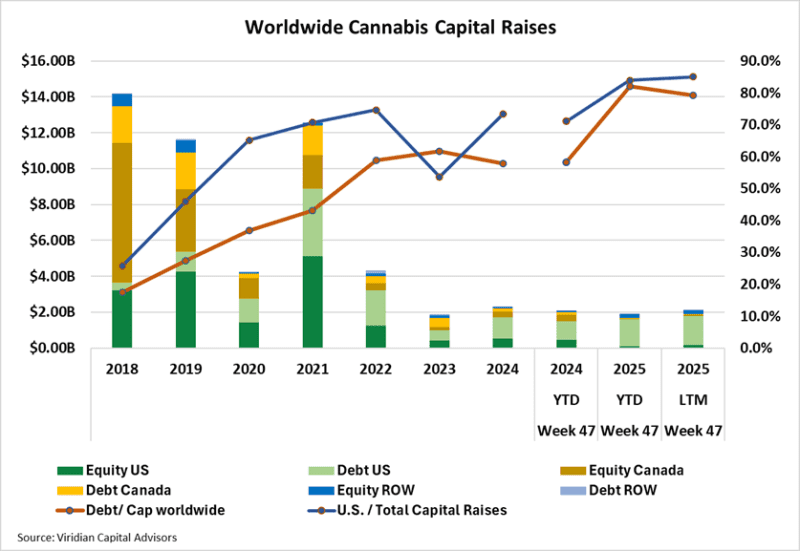
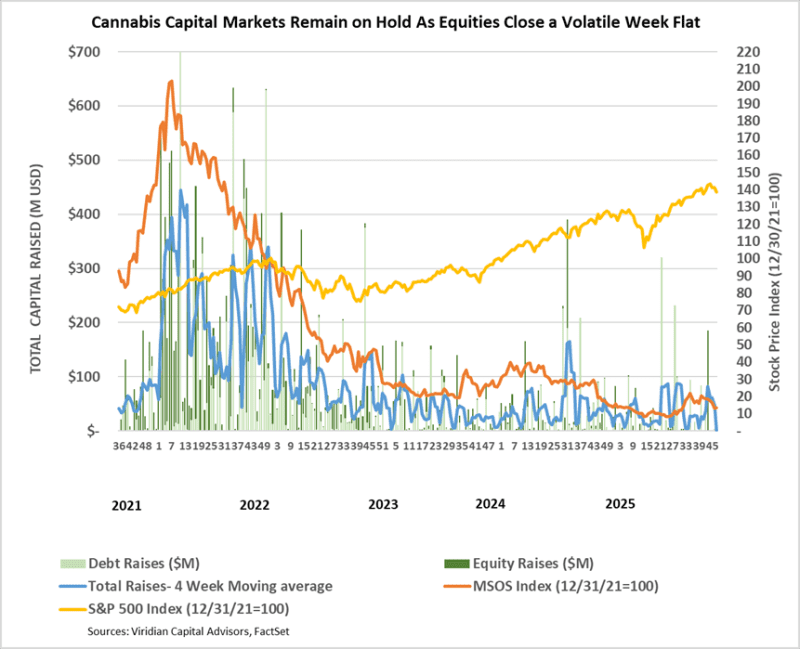
- YTD capital raises totaled $1.9B, down 9.6% from last year’s $2.1B. From an LTM view, capital raises totaled $2.12B, down 8.7% from the same period in 2024. Debt as a percentage of capital raised worldwide is 82.0%, compared to 58.2% in the previous year. U.S. raises YTD accounted for 83.9% of total funds, up from 71.2% at the same point in 2024. Raises from outside Canada and the U.S. accounted for 11.8% of total funds raised, more than double the average of 5.3% over the six previous years.
- Public company raises accounted for 92.8% of total raises in the LTM period, the highest in at least the last 7 years.
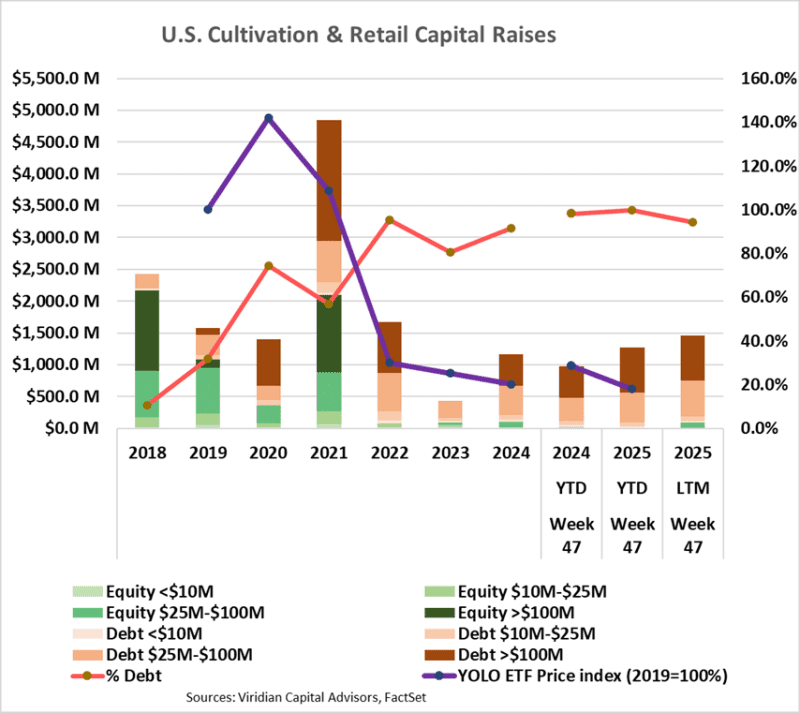
- YTD capital raises for the cultivation and retail sector total $1.28B, up 31.3% from last year’s $971.6M. For the LTM period, the capital raised in the cultivation and retail sector was $1.46B, 26.3% higher than in 2024, which in turn was 160% higher than in 2023.
- Debt accounts for a whopping 94.2% of the funds raised over the last 12 months (LTM). Large debt issues (over $100M) accounted for 56.0% of capital raised, up from 0% in 2023.
- Cannabis equity prices (as measured by the MSOS ETF) rose by 0.89% for the week.
VIRIDIAN INSIGHTS
-
- THE SUPREME COURT IS CONSIDERING WHETHER TO HEAR THE CASE OF CANNA PROVISION, INC. ET AL VS BIONDI, A POTENTIALLY FAR-REACHING CASE.
- The Court will conference on December 12, 2025, and a decision on whether to hear the case is expected on December 15, 2025.
- The Plaintiffs, which include Canna Provisions, Gyasi Sellers, Wiseacre Farm, and Verano Holdings, seek a declaratory judgment that the Controlled Substances Act (CSA) is unconstitutional as applied to their intrastate, state-legal cannabis activities, and an injunction blocking CSA enforcement against their activities.
- Key questions include:
- Should Gonzales v. Raich (2005) be overruled or cut back? Raich held that Congress could criminalize even intrastate, state-legal medical cannabis under the Commerce Clause and Necessary and Proper Clause.
- Does Congress still have constitutional authority to prohibit purely local, state-regulated cannabis, given how much federal and state policy has changed?
- The plaintiffs argue that the factual predicates of Raich are no longer true and that, in light of the facts below, Congress no longer has a “rational basis” for thinking that their intrastate, state-legal activity must be criminalized to protect interstate regulation.
- Since Raich. Congress has repeatedly adopted the Rohrabacher-Farr appropriations rider shielding compliant state medical programs from DOJ spending
- Dozens of states have created licensed adult-use markets that expressly prohibit interstate commerce
- The federal government tolerates the state programs rather than trying to wipe out all cannabis from the interstate market
- What lower courts did:
- The District Court dismissed the case, saying Raich controls and that only the Supreme Court can change that precedent
- The First Circuit affirmed in May 2025, holding that Raich remains binding and that Congress still has a rational basis for treating even purely intrastate commercial cannabis as part of a broader interstate regulatory scheme.
- Will the Case be Heard? Odds seem to be against it.
- The Supreme Court receives thousands of paid cert petitions each term and usually grants under 2% of them. On this basis alone, the odds are long.
- The Court tends to accept cases where there is a circuit split. There is no split here, further reducing the likelihood that the Court will take the case.
- Tim Swain (Vicente LLP, MA) also points out that the plaintiffs are commercial, for-profit operators, and that the Court would have to “ignore the commercial nature of the activity.”
- Swain also points to the pending Federal rescheduling as a reason for the Court to wait.
- What would a favorable ruling do?
- A successful challenge would buttress arguments that IRS rule 280E does not apply to compliant intrastate operators.
- Would substantially reduce banking and capital markets risk. If the CSA cannot be enforced against intrastate operators, it removes the risk that many banks and institutional investors point to: involvement in federally illegal “drug trafficking.”
- Conclusion: the odds of the Court even hearing the case are long, and the likelihood of the plaintiffs winning the case is even longer. However, the Court even agreeing to listen to the case would be seen as a major event in cannabis, and even a narrow victory would be as far-reaching as any of the other reforms under discussion.
- THE SUPREME COURT IS CONSIDERING WHETHER TO HEAR THE CASE OF CANNA PROVISION, INC. ET AL VS BIONDI, A POTENTIALLY FAR-REACHING CASE.
-
- THE MOOD OF THE MARKET IS SOMBER, AND TRANSACTIONS ARE ON HOLD, BUT GLIMMERS OF HOPE ARE STILL THERE
- We tracked zero debt or equity issues, nor did we see any closed M&A transactions this week. Stocks are volatile but trendless.
- There was virtually no significant news to report this week.
- We would have expected the hemp ban to spark celebrations in the regulated market, after ostensibly extinguishing a significant revenue leak. But the fact that a thriving industry could be squashed at the stroke of a pen has many of us questioning our assumption that political action in Washington can only be positive.
- Third-quarter results did nothing to raise the mood. Most competitors showed year-over-year declines in Sales, EBITDA, and Margins.
- All of this has led many industry folks to step into Thanksgiving with less than a thankful attitude.
- We will be out next week at MjBiz and hope to see more signs of positivity.
- Our conversations with debt shops this week revealed that several are hard at work on new deals. We hope some of this relates to the refinancing of major unresolved 2026 maturities; getting those out of the way would be a clear market positive.
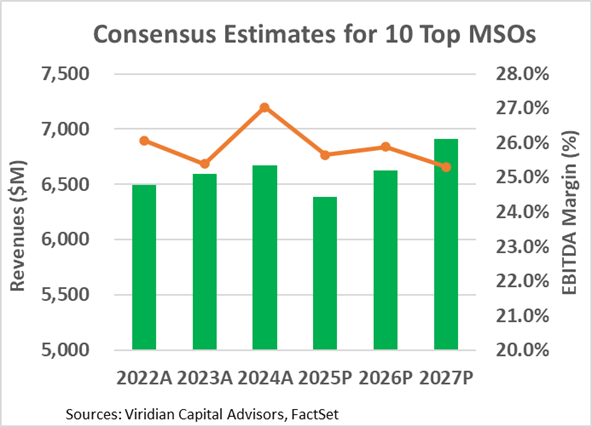
- We also note that analysts are upbeat about 2026. The Chart below shows historical and consensus revenue and EBITDA margin estimates for the top 10 MSOs for 2022 through 2027. Note that after a projected 4.2% decline in revenues in 2025, analysts are projecting a 3.8% increase in 2026. Aggregate margins are also projected to strengthen slightly, resulting in 4.7% EBITDA growth, a significant improvement from the 9.1% decline projected for 2025. So the bottom line is that companies are adapting to the environment and figuring out how to improve their operating profitability despite the headwinds we face.
- THE MOOD OF THE MARKET IS SOMBER, AND TRANSACTIONS ARE ON HOLD, BUT GLIMMERS OF HOPE ARE STILL THERE
-
-
- We continue to believe that S3 will happen, if not by the end of 2025, then during 2026. Although it’s not the complete descheduling many desire, it is a step in the right direction that will build momentum for future reforms. Our friend, Seth Yakatan, is fond of saying, “Hope is not a strategy,” and we are well aware of how many times we thought rescheduling was right around the corner, only to be disappointed. Yet we continue to be hopeful.
- But the one thing we are most Thankful for this week is the chance to be part of the dynamic and resilient industry we are in. Happy Thanksgiving to All!
-
-
- A DRACONIAN BILL APPEARS TO DEAL A DEATH BLOW TO HEMP
- On November 11, the Senate passed the Continuing Appropriations and Agriculture Appropriations Act, 2026, which included strong hemp provisions that will take effect 1 year from the bill’s effective date.
- Major sections of the bill include:
- Redefines hemp to include total THC, including THCA
- Bans all synthetic products produced outside of the plant, including D8, D10, THC-O, HHC, and THCP
- Bans products that contain more than .4mg total THC per container
- The impact of these changes is dramatic. They eliminate not only “gas station weed” but all THCA products and hemp-based THC beverages. Some commentators have suggested that the provisions could even catch some formulations of full-spectrum CBD.
- This type of total prohibition is irrational. It would be far more productive to bring hemp into a unified regulatory treatment along with regulated cannabis. Eliminating these products will result in the loss of thousands of jobs and millions of dollars in tax revenue.
- Regulated cannabis companies have blamed hemp for the lack of growth in the industry, and doubtlessly, there is some truth to that. Hemp is clearly a competitive “disruptive” product that combines lower prices and more convenient distribution. Consumers are basically saying that they do not care about the perceived safety of tested licensed cannabis (not like the testing is so dependable, mind you), but prefer the lower price.
- The law of unintended consequences is in full action here. Banning hemp will force a significant amount (if not a majority) of the revenue back into the illicit market rather than back into the dispensaries.
- It remains to be seen if the government really has the will to enforce the new “war on drugs” that will be required to make these bans effective.
- A DRACONIAN BILL APPEARS TO DEAL A DEATH BLOW TO HEMP
-
- THE ADVENT OF REVOLVING CREDIT AGREEMENTS IS A MAJOR ADVANCE IN CANNABIS CREDIT
- Over the last two weeks, Verano and Curaleaf have each announced new revolving credit agreements—the first of their kind in the cannabis industry—signaling the maturation of the cannabis debt capital market.
- They are not notable for their size, and it’s tempting to dismiss them because they do not appear to impact either company’s 2026 refinancing needs significantly.
- But that is not their intent, and misses the real importance of these deals. The key is that they offer an off-balance-sheet source of liquidity, allowing these companies to avoid holding as large a cash balance and achieve better asset efficiency.
- Most major US companies maintain undrawn revolving credit lines to augment liquidity for unforeseen cash requirements. Still, to date, cannabis companies have been unable to secure this type of unfunded commitment.
- The revolvers for Verano and Curaleaf also signal investor confidence that they will be able to refinance their 2026 maturities. This is particularly true for Verano. The Chicago Atlantic agented revolver matures in 2028, after the required refinancing of the Chicago Atlantic agented term loan. Would CA offer this revolver if there was any real doubt that Verano would be able to roll its 2026 maturities? Conversely, the Needham bank revolver for Curaleaf matures before the company’s 2026 maturities, providing weaker vote of confidence.
- THE ADVENT OF REVOLVING CREDIT AGREEMENTS IS A MAJOR ADVANCE IN CANNABIS CREDIT
-
- VIREO AND CHICAGO ATLANTIC USHER IN A NEW AGE OF CANNABIS RESTRUCTURING WITH THEIR SCHWAZZE TRANSACTIONS
- On October 2, 2025, Vireo entered into a definitive agreement to acquire approximately 86% of Schwazze’s outstanding senior secured convertible notes for approximately $62M payable in Vireo’s subordinated voting shares, valued at $0.54 per share. We estimate that the notes have PIK’d up to about $110M from the $103.1M figure in Schwazze’s 12/31/23 10K
- The Vireo transaction should be viewed in the context of a larger picture: the overall restructuring of Schwazze using credit bids via Article 9 of the UCC, a technique also being utilized in AYR, which we believe will be the future path of major cannabis restructurings. We refer readers to two other documents/news stories for deep background; see the footnotes at the end.
- We view the set of transactions through three lenses:
- The acquisition of Schwazze debt is a huge win for Vireo. Controlling 86% of the fulcrum security places Vireo in control of the credit bid for the majority of the assets of Schwazze. We estimate that the principal value of the senior secured converts has PIK’d up to approximately $110M from the original $95M and the $103.1M shown in the 2023 10K. The purchase of 86% of the outstanding debt for $62M implies a price of 65.5% of par. More importantly, we believe the ongoing EBITDA of the Schwazze assets subject to the credit bid should be approximately $35 million. Grossing the $62M to account for 100% of the issue, we get $72M for the senior secured debt, which would give us only 2.1x EBITDA on the purchase price. We think, however, that one also needs to add the $45M senior lender refinancing of seller notes to get the total enterprise value of $ 72M + $45M = $117M. It is also likely that the senior lenders will ultimately offer the Schwazze equity holders a carrot to help this transaction cross the finish line. Still, Vireo appears to be able to acquire the core Schwazze assets for only about 3.3 times EBITDA without using any cash. The transaction is tremendously accretive.
- Chicago Atlantic’s strategic position as both a lender to Schwazze and a significant shareholder in Vireo positions it as a lender/operator hybrid with an ability to more aggressively assert creditors’ rights than typical cannabis lenders, who typically avoid direct ownership due to federal illegality, regulatory hurdles, and operational complexities. This unwillingness to take control of operators is a key reason why so much “Amend, Extend & Pretend” has occurred in cannabis. Chicago Atlantic, through its close relationship with Vireo, is different. It can play hardball when necessary, knowing it has a place to park and rehabilitate problem assets. CA doesn’t control Vireo; we estimate that CA will own only around 12% of Vireo post-closing. However, the fact that the CEO of Vireo was a senior partner at CA tightens the relationship beyond what the raw numbers suggest. Chicago Atlantic and Vireo are uniquely positioned to roll up distressed U.S. cannabis operators.
- The transactions envisioned by Vireo and Chicago Atlantic usher in a new era of cannabis restructuring:
- Article 9 credit bids instead of receiverships
- Asset partitioning: selecting only the desirable assets and discarding the undesirable ones.
- Maintaining ongoing core operations rather than piecemeal liquidations
- An increasing use of “Liability Management Exercises”, also known as Creditor on Creditor Violence. Sharp-elbow techniques, common in the high-yield world, where senior secured lenders maximize their returns at the expense of other creditors, are making their way into cannabis restructurings. Subordinated debt is already scarce in cannabis, but it’s about to become even more so.
- Footnotes
- VIREO AND CHICAGO ATLANTIC USHER IN A NEW AGE OF CANNABIS RESTRUCTURING WITH THEIR SCHWAZZE TRANSACTIONS
-
-
-
-
- Altmore, another creditor at Schwazze, filed a complaint on May 3, 2025, in the District Court of Denver County Colrado, alleging that during discussions following the Company’s default on Altmore’s $15M senior secured loan, it was notified by Schwazze’s bankers that the Company and its secured lenders intended to pursue a restructuring transaction called a strict foreclosure under which the company’s assts would be divided into “good collateral” and “bad collateral” and a “NewCO” would acquire the “good collateral” while the “bad collateral” would be left behind. The banker informed Altmore that the bondholders and the company viewed Altmore’s collateral as “bad collateral,” but that it could possibly be included in the “good collateral” pool if Altmore agreed to reduce its principal balance by more than 70%. Altmore also alleged that the company had moved some of its collateral, including a preroll machine, out of the subsidiaries that Altmore is secured by. Altmore requests that a receiver be appointed to protect its creditors’ rights.
- A Bloomberg article on August 29, 2025, outlined a restructuring plan under which senior secured creditors would provide a $65 million cash infusion, allocating $45 million to refinance seller notes and the remaining $20 million to working capital. The senior lenders will then use a credit bid under Article 9 to acquire performing properties, while the others will be left behind to be wound down.
-
-
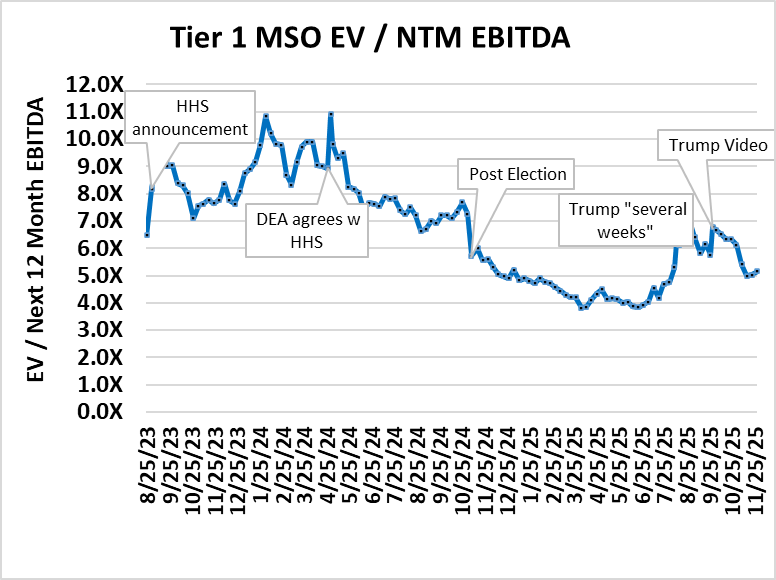
- THREE MONTHS AFTER WE WERE SUPPOSED TO HEAR ABOUT S3, THE MARKET IS QUESTIONING NOT JUST WHEN BUT IF IT WILL HAPPEN
- The Chart below shows aggregate enterprise value to next twelve months consensus EBITDA projections for six of the top MSOs, including Curaleaf, GTI, Trulieve, Verano, Cresco, and TerrAscend from 8/25/23 (the Friday before the HHS announcement) through 11/28/25 (nearly three months after the Trump Video Post)
- The MSOs are still holding on to a bit of the gains from the summer lows, when the top six MSOs were trading at around 4x next twelve-month consensus EBITDA, but after climbing to close to 7x, valuation metrics are now barely over 5x.
-
-
-
- All of the rumors of the government endorsing CBD use for seniors do little to quell fears of what might befall the adult rec state programs. The decimation of the hemp industry, which many cheer as removing unfair competition, also serves as a reminder of how perilous the legal position of the industry is. We placed significant weight on two aspects of Trump’s known leanings: 1) he is a believer in states’ rights, and 2) he is generally commercial and pro-business. But neither of these leanings helped the hemp industry. So, it’s natural to fear that there may be something worse than inaction in Washington – dramatic action in the wrong direction.
- Despite all of this, we still think Trump is likely to follow through on his campaign statements in support of S3, but his comments and video posts fail to give us any warm and fuzzy feeling.
- On the positive side, the market is trading at multiples that are lower than for most of cannabis history, except for the late 2024 and the first half of 2025 periods. That gives us some comfort that significant upside still exists if something more real than a tweet were to occur, while also limiting the downside from more time drift and investor skepticism.
- What would it take for us to become enthusiastic? How about a less-than-hostile mention of adult-use cannabis, which makes up around 70% of retail sales? Sharp legal minds like Dentons have assured us (via their recent write-up) that S3 would by necessity apply to all cannabis, as it is the substance that is classified, not the application. But we can’t help but think Trump would leave adult rec behind if he could.
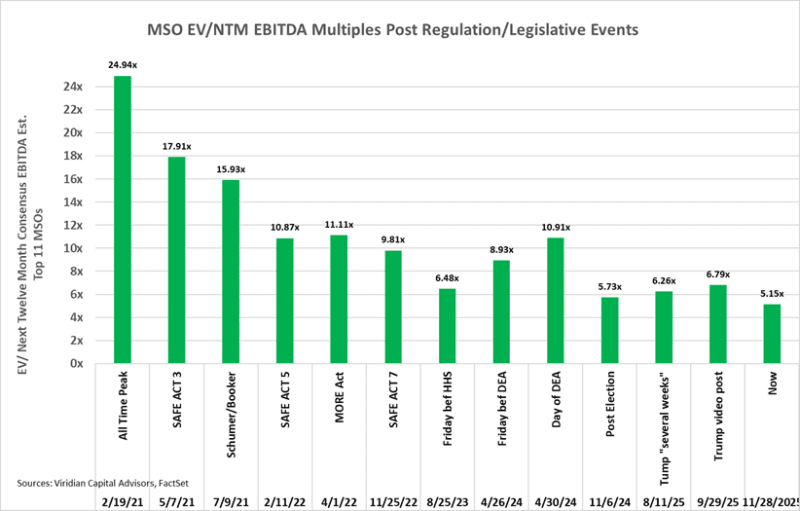
- For a longer-term reference on cannabis multiples and their reactions to various legislative/regulatory announcements, please see the graph below.
-
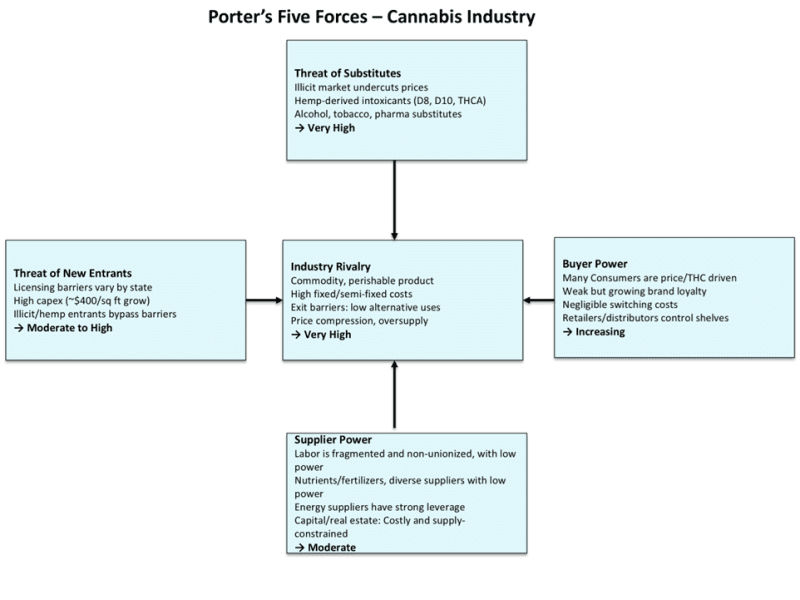
- RESCHEDULING, DESCHEDULING, LEGALIZATION…
- The potential impacts on the industry seem difficult to wrap your head around, so we wanted to go back to the fundamentals of the market structure of cannabis using Michael Porter’s Five Forces Framework, which decomposes the forces operating on an industry into the threat of substitutes, the threat of new entrants, the power of suppliers, and the power of buyers, which together influence the internal rivalry and degree of price competition in the industry.
- At the bottom of each force discussion, we comment on how legalization will impact the force and whether that impact will foster consolidation.
- We believe that eventual legalization will spur tremendous consolidation, which in turn will benefit the industry in several ways: greater price stability through an oligopolistic structure and centralization of production and distribution, both of which improve margins and capital efficiency, thereby increasing ROIC.
- The news isn’t all good, though. If descheduling were to occur without a phase-in period and without attempting to buffer the impact on limited-license state programs, it would be highly disruptive, likely causing a wave of facility shutdowns, write-offs, and layoffs. The retail side of the business would fare better, at least initially, as we would expect DTC sales to take some time to develop. This is why we believe the most important thing we’ve learned in our years in cannabis is “be careful what you wish for.”
-
Threat of Substitutes – Very High
- Illicit Market: The largest and most immediate substitute. Illicit operators face no compliance costs or taxes, and can undercut legal players by 30–50%. Consumer willingness to buy illicit products remains high due to habit, price sensitivity, and, in some cases, quality parity.
- Hemp-Derived Intoxicants: Delta-8, delta-10, and THCA products (often sold in gas stations and online) are federally legal under the 2018 Farm Bill loophole and are virtually perfect substitutes for cannabis flower and vapes. They carry lower production costs and fewer regulatory burdens.
- Other Recreational Substitutes: Alcohol, tobacco, and in some cases, prescription or over-the-counter pharmaceuticals compete for the same consumer leisure or therapeutic dollar.
- Overall: This force is very strong — substitutes put a permanent cap on pricing power and force legal operators into constant margin pressure.
- Consolidation Drivers/Impact: Larger, more efficient operators are better able to withstand ongoing margin compression. Descheduling/ legalization will accelerate the drive for roll-ups and M&A to create centralized production, distribution, and marketing. Consolidation will eventually foster a more oligopolistic price structure.
Threat of New Entrants – Moderate to High (State Dependent)
- Licensing Barriers: In theory, cannabis markets are shielded by limited-license regimes. In practice, states often over-issue cultivation or retail licenses (e.g., Michigan, Oklahoma), creating oversupply.
- Capital Requirements: Building an indoor facility costs ~$400 per sq. ft., with millions in capital expenditures required for cultivation
- Regulatory Hurdles: State-by-state rules slow new entry, but hemp-derived entrants largely circumvent these barriers.
- Overall, entry into licensed markets is difficult, but trivial in the case of hemp-derived substitutes or illicit channels — making this force stronger than it appears on paper.
- Consolidation Drivers/Impact: After descheduling/legalization barriers fall and tobacco, alcohol, CPG, and Pharma will enter, shifting power to larger players with capital and nationwide distribution networks. Existing MSOs merge to bulk up before these new players enter the market.
Bargaining Power of Suppliers – Moderate
- Labor: Fragmented, largely non-unionized, and specialized but replaceable. Worker turnover is high, limiting labor’s bargaining power.
- Nutrients/Fertilizer/Equipment: These suppliers are dependent on cannabis demand and lack leverage to raise prices materially.
- Energy: The most powerful supplier. Indoor grows are energy-intensive, and cannabis operators are price takers on local utility rates. Energy cost spikes directly erode margins.
- Real Estate/Financing: With federal illegality, cannabis companies often rely on expensive sale-leaseback arrangements (e.g., IIPR) and high-cost debt, which gives landlords and lenders unusual power relative to other industries.
- Overall: Supplier power is moderate — weak in raw materials, strong in energy and capital access.
- Consolidation Drivers/Impact: Descheduling/legalization reduces the cost of capital through uplistings and improved access to banking & securities. Larger firms tend to benefit differentially from these moves.
Bargaining Power of Buyers – Increasing
- Retail Consumers: Currently, brand loyalty is weak. Consumers shop on price and THC percentage, and can easily shift to cheaper or illicit alternatives.
- Retail Dispensaries: In vertically integrated markets, MSOs control both cultivation and retail operations, thereby reducing the leverage of buyers. But in wholesale-heavy states, retailers wield power by choosing which brands to stock.
- Large Buyers: Emerging multi-state wholesale distributors (and in hemp-derived products, convenience store chains) exert significant bargaining power by controlling shelf space.
- Overall, buyer power is rising, particularly as oversupply provides consumers and retailers with numerous
- Consolidation Drivers/Impact: Descheduling/ legalization will eventually allow national retailers to sell cannabis products. Only firms with nationwide logistics will effectively supply those buyers, reinforcing consolidation pressure.
Industry Rivalry – Very High
- Commodity Dynamics: Cannabis is a perishable commodity, as unsold flower loses potency, aroma, and value. Like airline seats, the incentive is always to sell inventory even if it requires price discounting.
- Fixed/Semi-Fixed Costs: Cultivation has high fixed and semi-fixed costs (especially energy for lights and HVAC). Once a grow is built, operators tend to run it at full capacity, covering variable expenses and making a contribution towards fixed costs. This tends to intensify oversupply.
- Exit Barriers: Specialized grow facilities and equipment have little alternative use value, locking weak competitors into the market and prolonging price wars and supply gluts.
- Growth and Profitability: Industry growth is slowing. 2025 is expected to show declining revenues among top MSOs, with only ~7% rebound projected in 2026 as Pennsylvania, Virginia, or Florida flip to adult use. Long-term growth is CPG-like (population + inflation) as the illicit market is converted to a legal one.
- Overall, the rivalry is cutthroat due to oversupply, price compression, and trapped capacity.
- Consolidation Drivers/Impact: Rivalry becomes national, not state-by-state. The weakest competitors exit, mid-tier firms merge for survival, and scale advantages (lower cost per pound, better logistics, stronger brands) drive consolidation
Summary: What the Five Forces Tell Us About Consolidation
- Before legalization: Fragmented, state-by-state markets with regulatory moats allow lots of small to mid-tier operators
- After descheduling: Forces flip toward economies of scale, lower capital costs, and national distribution requirements
- Result: The Five Forces indicate heavy consolidation, with parallels in the beer, tobacco, and pharmaceutical industries.
- Thousands of small local operators with a handful of dominant national and international firms. Survivors include some of today’s largest MSOs with strategic entrants from alcohol, CPG, and tobacco.
- THE 2026 DEBT MATURITY WAVE IS LOOKING LESS THREATENING: THE COMPANIES WITH THE RISKIEST REFINANCINGS HAVE ALREADY GONE INTO RECEIVERSHIP, NEGOTIATED AN EXTENSION, OR ARE PREPARING AN ARTICLE 9 SALE OF ASSETS TO CREDITORS
- Much has been made of the upcoming wave of cannabis debt maturities in 2026. The sheer Size is undoubtedly intimidating. The companies pictured on the graph below collectively have approximately $1.5 billion of debt maturing in 2026. (IAnthus maturities are actually in 6/27, but close enough!). This figure used to be over $2.3 billion, before Gold Flora, 4Front, and AYR flamed out, and we recently added Shwazze to the list. Cresco agreed to refinance its secured term loan. Putting that figure into perspective, $1.53B is still more than total cultivation & retail sector capital raises for any year since 2019, except for 2021 ($4,8B) and 2022 ($1.7B)
- Viridian is more constructive about the issue than most other industry observers. We observe that in the high-yield bond market, it is virtually never the case that debt is paid off in cash. It is generally refinanced, OR the company is forced to restructure. Obviously, given the lack of prepackaged bankruptcy (or any bankruptcy, for that matter), restructuring is rightfully a prospect to be feared in the Cannabis Industry.
- So, how do we gauge the risk of something going wrong in 2026? Refinancing risk is a peculiar mixture of market psychology and financial realities.
- The green bars show the 11/28/25 market-implied asset coverage of total liabilities. We arrive at this by viewing the equity as a call option on the firm’s asset value, with a strike price equal to its liabilities, and assuming a maturity of 2026, 30% volatility, and a risk-free rate of 4.25%. This provides us with all the elements of the Black-Scholes option-pricing formula except the current asset value. By iterating on the BS model, we can determine the market’s assumption about asset value. The importance of this data point should be obvious. For companies with less than 1x asset coverage of liabilities, debt providers are effectively making an equity bet. They do not have adequate asset value coverage to fall back upon.
- The red line represents the Viridian Capital credit ranking, which considers four key credit factors: Liquidity, Leverage, Profitability, and Size. Refinancing will be more difficult for weaker credits (higher numbers). Companies with ranks of under 12 are in the top half of the Viridian-ranked universe of credits.
- The black dots represent the multiples of market cap for the 2026 debt maturities. Clearly, the larger the debt maturities relative to the market cap, the more difficult refinancing would be.
- The companies to the right of Jushi (JUSHF: OTCQX) on this graph represent higher risk. They have less than 1x asset coverage, generally poor Viridian Credit Ranks, and several, such as IAnthus and Body & Mind, have maturing debt that is multiples of their market capitalization. Companies in this position represent only about $170M of the maturing debt.
- Conversely, the companies on the left-hand side of the graph represent lower refinancing risk. They have solid asset coverage, strong Viridian Credit Ranks, and maturing debt that is less than 1.25x times their market capitalization. These companies represent $1.36 billion of the $1.53 billion total (70%), and we believe they should all be able to refinance their maturities without undue hardship. The offered side quotes on Curaleaf, Verano, and Trulieve—the solid credit MSOS with the most remaining 2026 maturities—have tightened significantly since the Cresco deal. Investor psychology appears to have shifted, with a growing belief that these names can refinance their maturities without undue hardship.
- But market psychology can be fragile. There is always the possibility of an “accident” where negative psychology meets illiquid funding markets, and refinancings that appear favorable on paper fail to materialize. An adverse ruling on rescheduling could raise the threat level back to previous peaks.

-
- HOW MUCH OF THOSE 280E SAVINGS WILL FIRMS ACTUALLY BE ABLE TO KEEP?
-
-
- Every analysis we have seen regarding the impact on credit capacity, valuation, or growth from the elimination of 280E begins with a simple yet probably incorrect assumption: that the tax savings from eliminating 280E will flow directly to free cash flow.
- This is clearly not the case, however. Some of the savings, and possibly the majority, are likely to be passed through to consumers via lower prices.
- One historical example that demonstrates this point is the 2022 elimination of the cultivation tax in California. The $ 161-per-pound tax equated to roughly 10-15% of the value when pounds were clearing at $1,000-$1,500 per pound. However, according to figures from MJBIZ, California production revenue dropped nearly 27% in 2022, more than offsetting the excise tax benefit. The hoped-for shot in the arm for California cultivators never happened.
- The ability to retain tax savings varies significantly across markets. Operators in markets with many competitors and a vibrant illicit market are likely to keep very little of the savings. On the other hand, lower prices may allow a recapture of sales from the illegal market. The net impact can be approximated based on two variables: the number of competitors in the market and the price elasticity of demand.
- The Cournot model is a simple economic model that describes competition when firms sell a relatively undifferentiated product. Each firm chooses the quantity it will produce, assuming rivals’ outputs are fixed, knowing that the market price will be whatever clears the market at the total amount produced. The strategic “best responses” to one another’s quantities define a Nash equilibrium: with few firms, each has market power (the price stays above the cost), and as the number of firms N increases, the outcome drifts toward perfect competition. In the symmetric, linear-demand case, it gives clean rules of thumb: firms will retain only 1/(N+1) of the tax savings, where N is the number of competitors in the market.
- There is another side to the story, though. The other variable in our analysis, the price elasticity, determines the degree to which firms will recapture sales from the illicit market. If the elasticity is below 1, sales react weakly to a price change, whereas if e > 1, sales react strongly to a price change. We have modeled e at 0.6, 0.9, and 1.2 to correspond with our assumptions of N = 5, 10, and 50. Each set of beliefs about N and e defines a market type.
- The Chart below shows that in oligopolistic markets with few competitors and low price elasticity, firms will retain around 22% of the tax savings. Around 17% of that comes from tax savings not passed through to consumers, while the other 5% comes from the extra FCF from incremental sales from the illegal market. The situation is reversed in markets with many competitors and high elasticity: only 2% of tax savings is retained, but incremental FCF equivalent to 12% of the tax savings comes from recaptured illegal sales.
- The bottom line is that modeling based on reasonable assumptions suggests that, while S3 remains quite positive for the industry, the impacts are likely overstated.
-

-
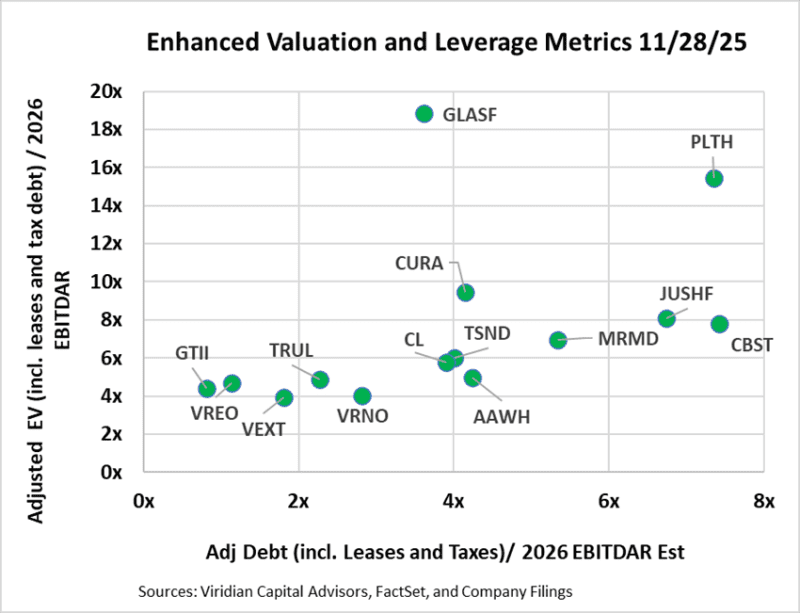
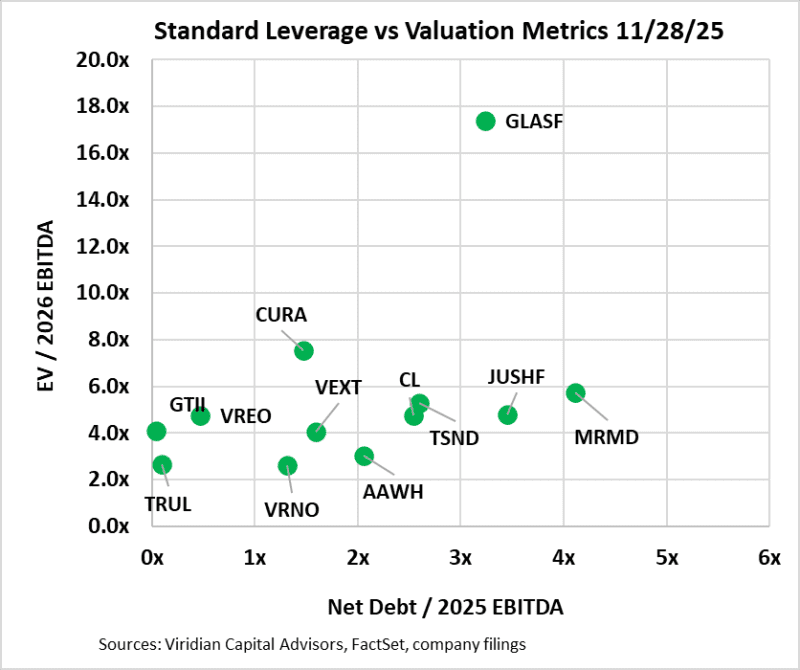
- MEASURES OF MSO VALUATION, LEVERAGE, AND LIQUIDITY
- The first two graphs present different versions of EV/EBITDA on the vertical axis and Debt/EBITDA on the horizontal axis.
- The first graph presents our latest view of the most appropriate valuation and financial statement-based leverage metrics: Adjusted Enterprise Value (EV) / 2026 EBITDAR and Adjusted Net Debt / 2026 EBITDAR. In calculating Adjusted Net Debt, we make several key assumptions: 1) Leases that are included on the balance sheet are considered debt. We view most leases in the cannabis space as equivalents to equipment loans or mortgage loans. While it is true that a lease default does not necessarily trigger a cascade of events leading to bankruptcy, the distinction is often meaningless in the Cannabis Industry due to the mission-critical nature of many long-term leases and the absence of bankruptcy protection in This Sector. 2) We consider any accrued taxes (including uncertain tax liability accounts listed as long-term liabilities) in excess of the most recent quarterly tax expense to be debt. Our calculation of enterprise value is now market cap plus debt plus leases plus tax debt minus cash. We now use EBITDAR rather than EBITDA, as lease expense is deducted before EBITDA is calculated.
- Our adoption of new metrics tends to make the companies look less cheap and more leveraged.
- The second graph utilizes EBITDA and employs traditional calculations for both debt and enterprise values, excluding leases and taxes.
- Surprisingly, eight of the companies on the enhanced metric Chart are still above 3x leverage, which we have identified as the boundary of sustainability in a 280e environment. Five companies now exceed 4x leverage, which we believe will be close to the maximum sustainable post-280E.
- Glass House is a valuation outlier. We have been positive on Glass House for quite a while, but the multiple spread to the nearest competitor is straining our resolve. Analysts are projecting a 43% y/o/y revenue decline in Q3 and EBITDA dropping to $-2.3M from $20.4M in 2024.
- MEASURES OF MSO VALUATION, LEVERAGE, AND LIQUIDITY
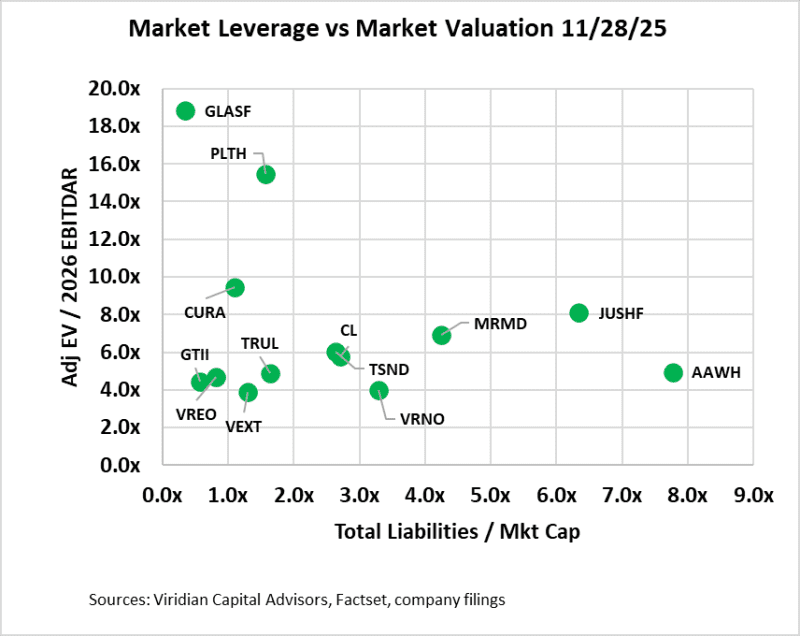
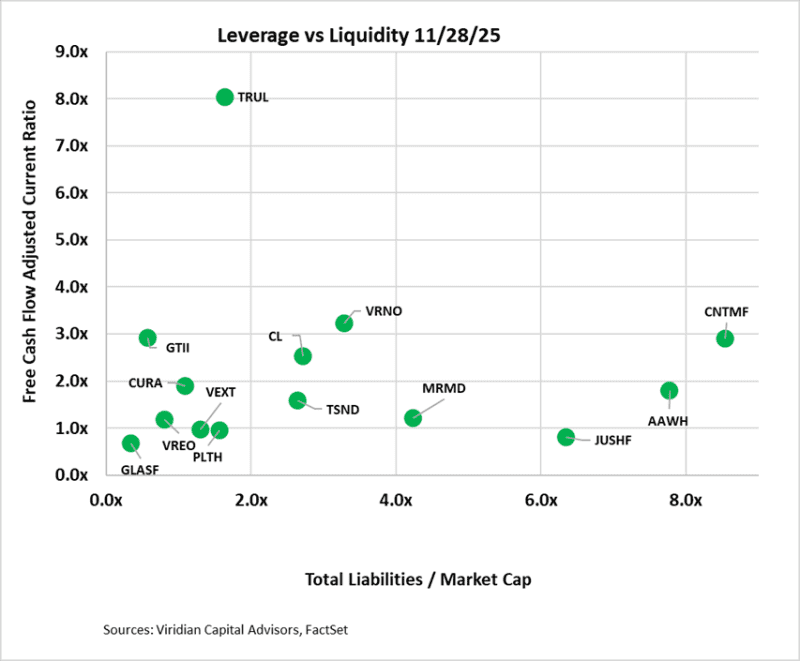
- The third graph examines leverage through the lens of total liabilities to market capitalization. We believe this is the single best measure of leverage because it reflects the market’s assessment of a company’s assets in excess of its liabilities and is sensitive to changes in the market’s perception of a company’s future prospects.
- On the bottom left are companies with an Adj. EV/2025 EBITDAR ratio of under 7x and total liabilities to market cap of under 2x. The group includes GTI, Trulieve, Verano, Cresco, and Vext. Companies in this quadrant are right to consider stock repurchases or using cash in acquisitions. They can afford some additional debt and can take advantage of the ongoing dislocation in equity prices.
- Between 2x and 5x total liabilities to market cap, we find MariMed and Jushi. Jushi is interesting because its liabilities include nearly equal amounts of 2026 debt maturities and uncertain tax liabilities.
- On the right lies Cannabist (off the Chart to the right) and Ascend, both over 5 times, a range that signals stress, if not distress. Ascend appears to be looking much better than it did three weeks ago, thanks to its stock rally.
- The fourth graph introduces the free cash flow adjusted current ratio liquidity measure into the mix. Note that we have recently modified our treatment of this ratio by removing uncertain tax liabilities from current liabilities, where they were previously placed. The result is that only Jushi and Cannabist are significantly below 1x free cash flow adjusted current ratio.
- On the top left, we find companies with adequate liquidity and low market leverage, including GTI, Trulieve, and Glass House. Companies in the lower right generally have constrained liquidity and high leverage, a potentially dangerous combination in a capital-constrained environment.
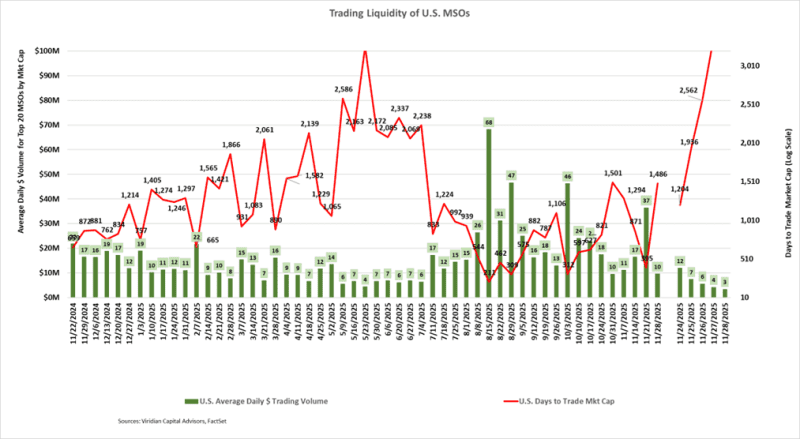
- VOLUME DISSAPPEARS HEADING INTO HOLIDAY WEEKEND
- The average daily dollar volume of $10 million for the week ending November 28, 2025, ties the lowest week since July 4th. The current Days to Trade the Market Cap (DTTMC) of 1496 has skyrocketed from the 52-week average of 1106 and last week’s reading of 335. A DTTMC of 335 means that an investor who acquired a 5% position in the stock, assuming they wanted to be less than 25% of the average daily dollar volume, would require 299 days to trade out of their position!
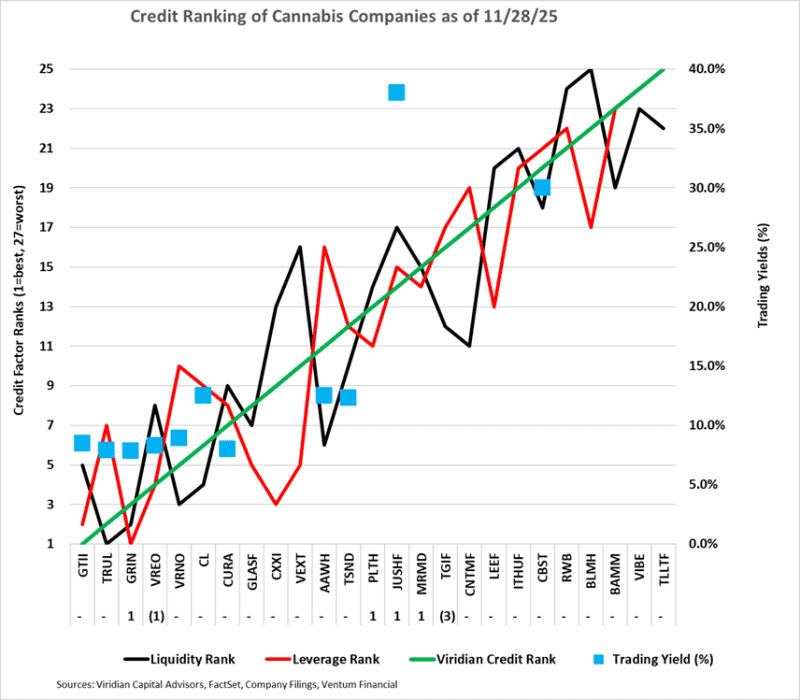
- GIVING CREDIT WHERE CREDIT IS DUE
-
- The Chart below displays our updated credit rankings for 25 U.S. cannabis companies as of November 28, 2025. We have reduced our ranking set from 30 to 25 companies by eliminating AYR, CLS, FFNT, GRAM, and SHWZ. Each of these companies is either in receivership (FFNT, GRAM), in restructuring discussions (AYR & SHWZ), or has out-of-date financials (AYR, FFNT, GRAM, SHWZ). Additionally, each trade is significantly out of the money, with stock price movements driven primarily by volatility rather than valuation.
- The blue squares show the offered-side trading yields for each Company.
- We find it curious that Cresco, TerrAscend, and Ascend are all trading within 25 basis points of each other. All three have refinanced their 2026 maturities, but we rank Cresco four notches better than Ascend and five notches better than TerrAscend.
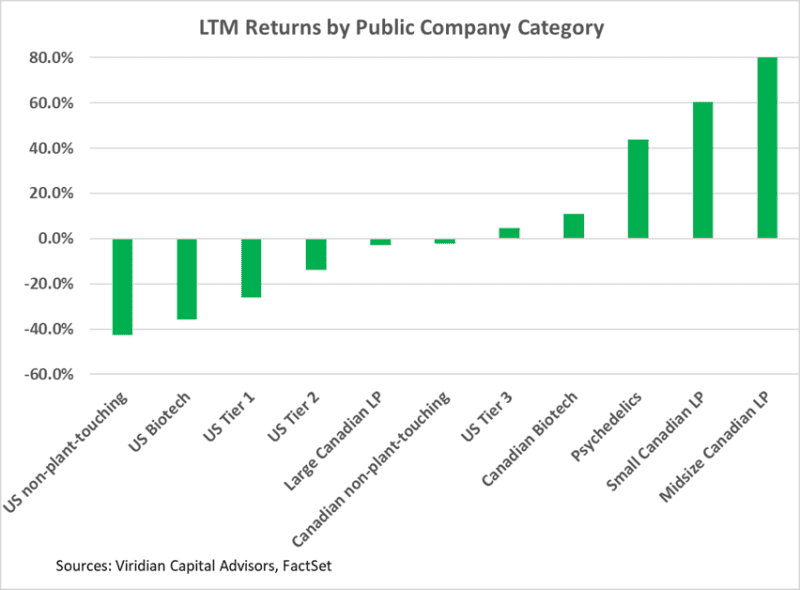
TRADING RETURNS FOR PUBLIC COMPANIES BY CATEGORY
-
- Plant-touching categories are still negative for the LTM period, but have clearly reduced their losses YTD.
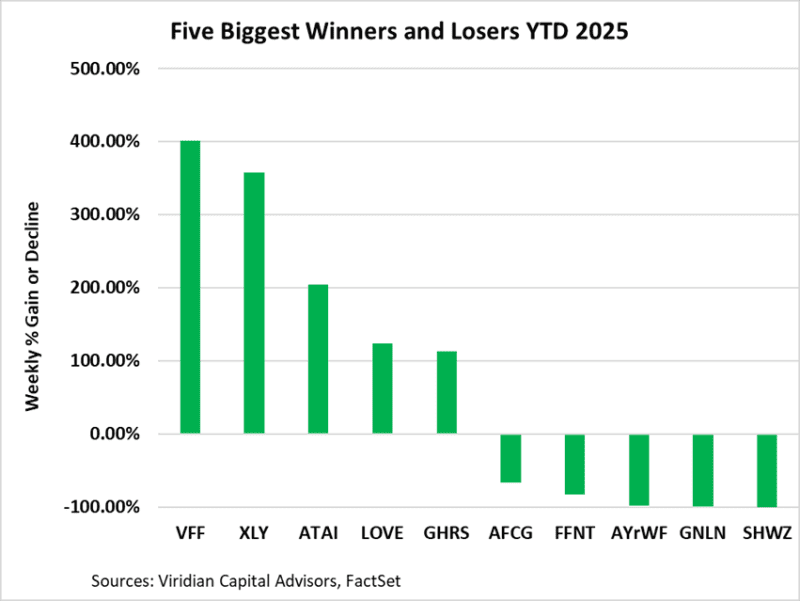
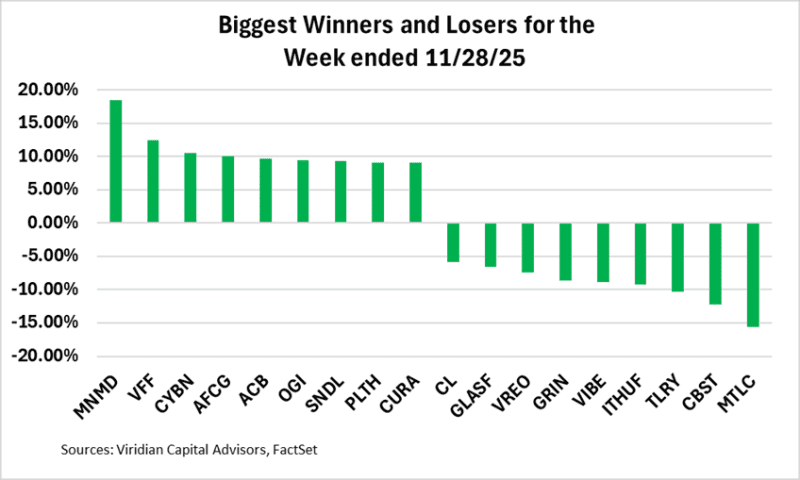
Best and Worst Performers for the week:
-
- In quiet pre-holiday trading, volatility was substantially reduced. Canadian operators, including Village Farms, Organigram, SNDL, and Aurora, figured prominently in the gainers’ list. Planet 13 and Curaleaf were among the top ten gainers for the second week in a row. Losers included companies that rank as stressed credits on the Viridian Credit Tracker, including iAnthus, Cannabist, and Vibe.