Each week, Viridian publishes insights and analysis on completed capital raise transactions in the prior week, focusing on all equity and debt deals. Our analysis includes:
- Summary
- Outlook
- Best & Worst Perfromers
- YTD capital raises totaled $690M, down 12.4% from the same period in 2023. Debt as a percentage of capital raised dropped sharply to 27.4% from 62.2% in the previous year on a worldwide basis. The U.S. bucked this trend with 58.8% of capital raised in debt compared to 49.3% in 2023
- U.S. raises accounted for 46.2% of total funds, the lowest percentage since 2019. Conversely, raises from outside the U.S. represented a historically high 11.2% of the total funds raised.
- YTD raises by public companies accounted for 61% of total funds.

VIRIDIAN INSIGHTS
- VIRIDIAN INSIGHTS
- A TALE OF TWO CANOPYs: Fanfare and Celebration About Canopy USA Meets Debt Market Reality in an Unusually Expensive Convertible Bond
- On May 7, 2024, Canopy exercised its options to acquire Wanna Brands and Lemurian Inc. (Jetty) with plans also to add Acreage under the Canopy USA umbrella. Now comes the challenge of integrating the operations in a way that makes the combination competitive in the U.S. marketplace.
- There was never a doubt that Canopy Growth’s ability to highlight the results of its US operations was a good thing. A glance at the parent’s numbers will clear any doubt on that score.
- No one thinks cross-border traffic in cannabis is happening anytime soon, if ever, and the ability of the parent to maintain an ability to fund the expansion of its US assets remains a question mark.
- Against that happy backdrop, we have the announcement of a complicated financing/restructuring move geared to raise US$50M.
- On May 2, 2024, Canopy entered into an exchange and subscription agreement under which the company will raise gross proceeds of US$50 and convert C$27.5M of its Supreme Cannabis converts that mature in 2025 into a new C$96.4M 7.5% convertible note due 2029.
- The note is convertible at $14.38 per share, which is a 3.15% premium to the stock price at the time of the pricing. The single investor will also receive 3.35M warrants with a strike price of C16.18 (a 16.1% premium)
- Assuming we count the Supreme bonds at par value (a potentially heroic assumption), after evaluating all of the embedded options given away in this financing, we calculate an all in cost to Canopy of 23.48%!
- Did the investor drive a tough bargain, or is this where a seemingly perpetually negative cash flow company ends up financing itself? It’s probably somewhere in between, we guess, but it does take a bit of the shine off the Canopy USA party banner.
- To the company’s credit, they have learned the cardinal rule of cannabis financing: take it when it’s available.
- IS IT REALLY POSSIBLE THAT RESCHEDULING WAS ANNOUNCED AND NOBODY CARED?
- On April 30, the DEA confirmed to the Associated Press that it will move to reschedule cannabis to Schedule 3 as recommended by the federal Health and Human Services Department.
- The ruling is the most critical since the first state legalization, significantly improving cash flows to the industry by eliminating IRS rule 280e.
- The impacts are diverse and strongly positive:
- A massive increase in industry cash flow. In our 2024 outlook in January, we affirmed our belief that rescheduling would happen. The industry is looking at a potential savings of $2B with more than $700M from just the top ten companies. Moreover, many of these companies are likely to start the savings program early by just not paying.
- Reinvigoration of the Cannabis Capital Markets. For the last few months, we have been talking about the cannabis capital markets being frozen due to the uncertainty surrounding rescheduling. We are now about to see the reversal of that process. Several companies have existing shelf registrations, and we expect companies to “average up” by doing minor equity issues as prices continue to recover.
- New investors at the margin. We don’t think rescheduling by itself will bring the Blackrocks of the world to cannabis. Still, the greater optimism surrounding the industry’s financial footing will attract more investors who will initially be drawn to larger companies.
- A kick-save to overleveraged companies. Increased free cash flow from lower taxes has a direct impact on the sustainability of debt. We have noted that more than half of the large MSOs have more than 3x debt/2024 EBITDA, a level we believed unsustainable in a 280e world. We have noted our belief that a likely catalyst would both increase debt sustainability and provide an opportunity for re-equitization.
- A re-acceleration of industry consolidation. M&A has been in the doldrums as companies conserve cash and focus on operating for profitability rather than growth. However, the valuation gap rebounded to 3.55 on the DEA news, the second highest it has been since May 2021 (the highest was 3.71 on 2/24). This gap will grow as the markets rally further, and it indicates a growing ability for the most prominent companies to complete accretive acquisitions. We predicted a resurgence of M&A at the beginning of the year, and finally, the catalyst has occurred. The catch is that we do not see a return to deals with high cash percentages, and our chart for the week shows an uptick in stock-based consideration.
- The graph below shows the impact of past legislative/regulatory announcements on the trading multiples of cannabis companies. EV/NTM EBITDA multiples rose nearly 20% on Tuesday to 10.22x following the DEA news before drifting lower through the end of the week. We believe that a much higher gain is in store. Specifically, we have been saying that we expect the market to rally beyond the 15.73x multiples from the Schumer/Booker proposal, possibly reaching the 18.35x achieved in May 2021 after the 5th House passage of the Safe Act.
- Progress leads to progress. We remain skeptical about the SAFER ACT in a highly charged election year. However, rescheduling is part of a process of normalizing cannabis that we believe increases the chance of the bill. The industry potentially now has multiple shots on goal: S3, the Boies Lawsuit, SAFER, and a Garland memo. Some combination of S3, SAFER, Boies, and Garland are becoming increasingly likely.
- So what could go wrong, and why has the stock market response been so muted?
- Investors are tired and have been spoofed too many times. When someone says, “It could take up to a year…” Cannabis investors immediately think, “It’s never going to happen.”
- The investor base is heavily retail and may not fully understand the potential implications of rescheduling or the impact of the removal of 280e.
- Investors, especially institutional investors who have avoided the space, would rather miss part of the rally than jump in for another ride like the last two years. Talking to investors, rating agencies, and other constituents, we find deep distrust for administrative actions like rescheduling. It is ironic that the very lack of congressional involvement that makes S3 likely to happen also imbues it with an aura of impermanence. Like the Cole memo, the fear is that a new administration may delay implementation or even reverse course.
- Many details still need to be worked out, and investors still question how the State programs, the FDA, and Big Pharma will interact in an S3 world.
- One of our readers, Adam Smith, also raised a good point when he questioned how much of the tax savings will be given back to consumers in terms of lower prices. He correctly asserted that in more competitive markets like California, competitive pressures may lead to most of the gains being competed away.
- Still, despite the uncertain timing, regulatory implementation, etc., our view is that the various regulatory, judicial, and legislative tracks for cannabis industry reforms are mutually reinforcing. We have never seen so many potential upside catalysts in any other industry.
- A TALE OF TWO CANOPYs: Fanfare and Celebration About Canopy USA Meets Debt Market Reality in an Unusually Expensive Convertible Bond

-
- WHAT IS THE MARKET REALLY LOOKING FOR IN FIRST-QUARTER EARNINGS RELEASES OVER THE NEXT TWO WEEKS?
- The market is likely to focus on non-earnings-related items in the releases and calls:
-
-
- Many companies will adopt the stance that they will not be paying 280e taxes.
- Some companies may follow Trulieve and TerrAscend in moving accrued 280e liabilities into a long-term liability account, improving their stated working capital.
- Will companies express higher growth aspirations or guide to higher capex numbers?
- As always, we will be looking more towards 2024 and 2025 revisions than the actual Q1 results.
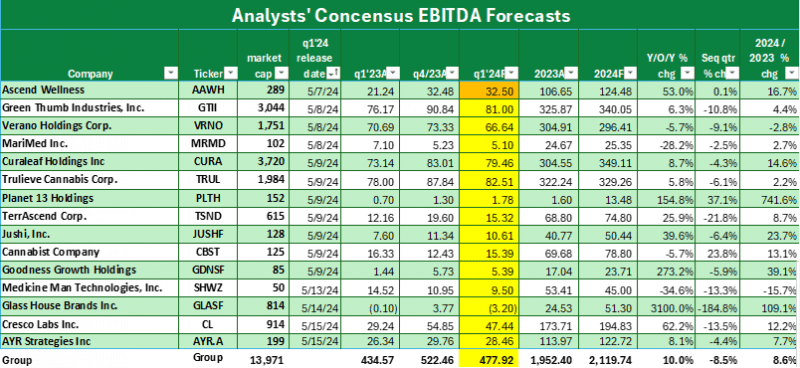
- The estimates for Q1 are unexciting.
- The table below shows the consensus EBITDA estimates for Q1 2024 (in yellow) and compares them with the first quarter of 2023 and the fourth quarter of 2023.
- The sequential quarter growth is negative for 12 of the 13 companies on the chart, reflecting seasonality. The 9.1% sequential decline is somewhat higher than last year’s 5.8% drop but in line with 2022’s 8.1% decline.
- Projected year-over-year EBITDA growth for Q1 is 10.0%, slowing to 8.6% for the full year 2024.
-
- The Chart below shows that the 8.6% 2024 EBITDA growth for the group is composed of 4.2% revenue growth and a 1.1-point increase in EBITDA margins from 24.4% to 25.5%. Both of these strike us as overly conservative.
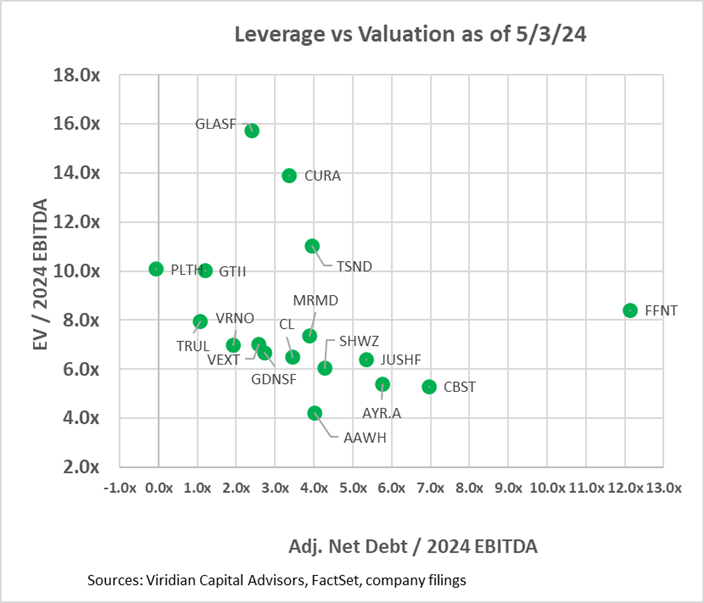
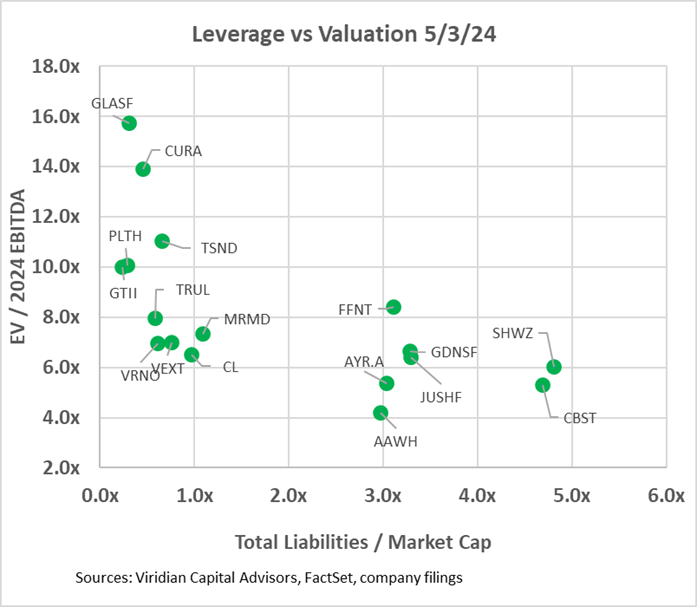
- VALUATION, LEVERAGE, AND LIQUIDITY
- The two graphs below show the Enterprise value to 2024 EBITDA multiples against two leverage measures. In the first graph, we have calculated an Adjusted Net Debt/ 2024 EBITDA figure by adding any accrued taxes over 90 days of tax expense to debt before subtracting cash to arrive at Adjusted Net Debt. We would expect any regular company to have accrued taxes equal to their last quarterly tax expense and consider that a standard working capital item. Several companies on the chart have far greater than 90 days of accrued taxes, and we consider the excess to be debt. Verano’s excess tax liabilities equal nearly 40% of its debt. Other companies with relatively high imputed tax debt include Curaleaf (CURA: CSE), 4Front (FFNT: CSE) at 19%, and Terrascend (TSND: TSX) at 17%. We have adjusted our accrued tax liabilities for comparability by adding back the tax liabilities that Trulieve and TerrAscend moved into long-term liability accounts.
- The first graph shows that ten of the seventeen companies have net debt/ 2024 EBITDA over 3x, which we view as the cutoff of sustainability in a 280e world. We view 4x as sustainable in a post-280e environment, and five companies are now over that threshold.
- The second graph looks at leverage through the lens of total liabilities to market cap. This measure separates the companies into three groups:
- On the bottom left are companies with low valuation multiples but also low market leverage. The group includes Verano, Trulieve, Cresco, MariMed, and Vext. With regard to Vext and MariMed, the consensus seems to be that both lack sufficient scale for the long run. Vext is small enough and geographically constrained enough to be a takeout candidate, while MariMed is priced attractively based on its fundamentals. However, it is geographically diversified enough to pose issues of overlap with potential acquirers. The other three show that the market is not yet willing to fully sign on to the Florida rec story.
- Meanwhile, in the bottom right are companies where the market has doubts about whether the company can discharge its liabilities without highly dilutive actions, like discounted stock sales or refinancing debt with a heavy warrant or share consideration.
- And in the top left, the darlings of the market. These companies have high valuation multiples and low market leverage. They have excellent currency for acquisitions but could also stand more leverage if a great debt deal were to be possible. These companies may be candidates to buy cash flow through accretive acquisitions.
- The third graph introduces the free cash flow adjusted current ratio liquidity measure into the mix. Companies with less than 1x on this measure will likely have to raise capital next year. Surprisingly, seven of the companies fall into this bucket. Note the lower liquidity position of Trulieve and TerrAscend relative to last week’s graph. This graph also breaks the sector into three distinct groupings. The bottom left group has low leverage but also modest liquidity. Some of the companies, including Verano, MariMed, and Cresco, have sufficient but not comfortable levels of liquidity, while others, including Curaleaf, TerrAscend, and Glass House, are below the critical 1x liquidity line. Companies on the lower right generally have constrained liquidity and high leverage, a potentially dangerous combination in a capital-constrained environment. Several of these have high optionality, however. Jushi, for example, is highly influenced by developments in Virginia and Pennsylvania. 4Front’s finances are dependent on the success of its massive Illinois cultivation project. AYR’s success rides heavily on Florida. Each of these companies bears careful monitoring. We know what to look for, but guessing the outcomes is nearly impossible. Ascend is a particular case and shows up on the graph in a region of its own. It looks to have excellent liquidity; however, this disguises the material debt maturities facing the company in 2025, which is just beyond the purview of our liquidity ratio.
- Looking at leverage in two ways and having a comprehensive measure of liquidity can give investors a good idea of possible scenarios for today’s overleveraged companies.

-
-
- CANNABIS STOCK LIQUIDITY POPPED TO PREVIOUSLY UNSEEN HIGHS ON APRIL 30 FOLLOWING THE DEA LEAK
- The $248M dollar volume for the top fourteen companies was unprecedented.
- The Days to Trade Market Cap (DTTMC) series depicts the number of days it would take to trade the market cap of a stock or group of stocks. Its weekly reading on 5/3/24 of 152 days is the best reading on the chart. A 152 DTTMC implies that an investor who acquired a 5% position in the stock, assuming he wanted to be less than 25% of the average daily dollar volume, would require 30 days to trade out of his position (down from 169 days last week.)
- The five bars on the far right show the daily activity and liquidity readings, which show that after that one glorious day, volume and DTTMC returned to the levels before the DEA announcement.
- CANNABIS STOCK LIQUIDITY POPPED TO PREVIOUSLY UNSEEN HIGHS ON APRIL 30 FOLLOWING THE DEA LEAK
-


-
-
- GIVING CREDIT WHERE CREDIT IS DUE (to be revised in this week’s credit tracker for the impact of the DEA announcement)
- The chart below shows our updated 5/3/24 credit rankings for the 30 U.S. cannabis companies with over $5M market cap. The number below the ticker symbol indicates the change in credit ranking since last week, where a negative number suggests credit deterioration, while a positive indicates improvement.
- The blue squares show the offered-side trading yields for each company. Trading yields have declined significantly since the HHS rescheduling announcement.
- The spreads between GTI, Trulieve, and Curaleaf all widened this week.
- Curaleaf, Cresco, and Verano now trade at similar yields, and the premium to Trulieve is now starting to look too wide. Similarly, the two hundred basis points between Trulieve and GTI look too extreme, and GTI’s absolute yield level of 7% seems too tight relative to treasuries. We have no question that GTI is the best credit for the group, but investors can now pick up nearly 400 basis points by trading into Verano paper.
- Cansortium moved sharply lower in the rankings despite solid stock price performance due to the new financial results, which showed lower year-over-year cash flow for the December quarter. We remind investors that the company has the most Florida adult rec torque of any of the companies we rank.
- Leef Brands gained 4 ranking notches based on its debt restructuring, in which it converted part of its 2024 maturing debt into equity and extended the maturity of the remainder. This improved liquidity and leverage factors in our model.
- GIVING CREDIT WHERE CREDIT IS DUE (to be revised in this week’s credit tracker for the impact of the DEA announcement)
-

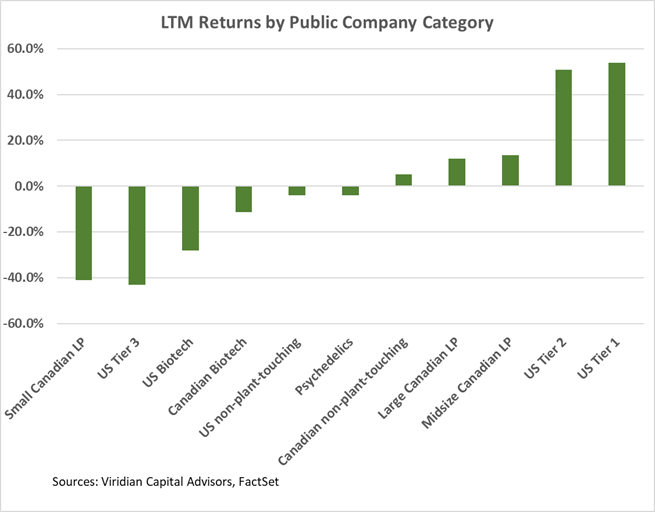
Trailing 52-Week Returns by Public Company Category:
- U.S. Tier One MSOs are now up over 50% for the LTM period, and Large Canadian L.P.s are now up around 17%.
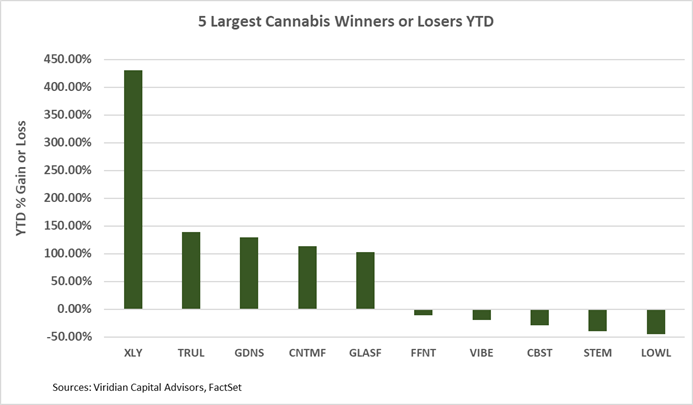
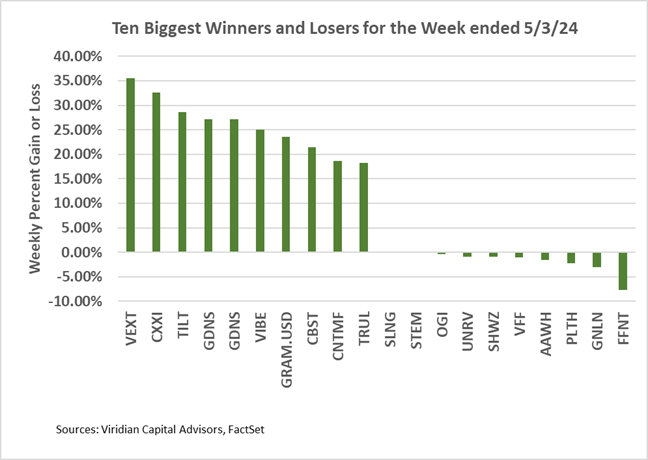
Best and Worst Performers of the last week and YTD:
- The winners list has several of the bottom tier credits, including TILT, GDNS, GRAM, CBST, Vibe, and LOWL, all of whom would benefit from a rescheduling-induced easing of capital market conditions. Florida levered Cansoritum and Trulieve also place in the top ten.
- Not many losers in a market like last week, but 4Front, down 7.66%, leads the pack.