OUR 9TH YEAR OF PROVIDING PROPRIETARY CAPITAL MARKETS INTELLIGENCE ON THE CANNABIS / HEMP / PSYCHEDELIC SECTORS
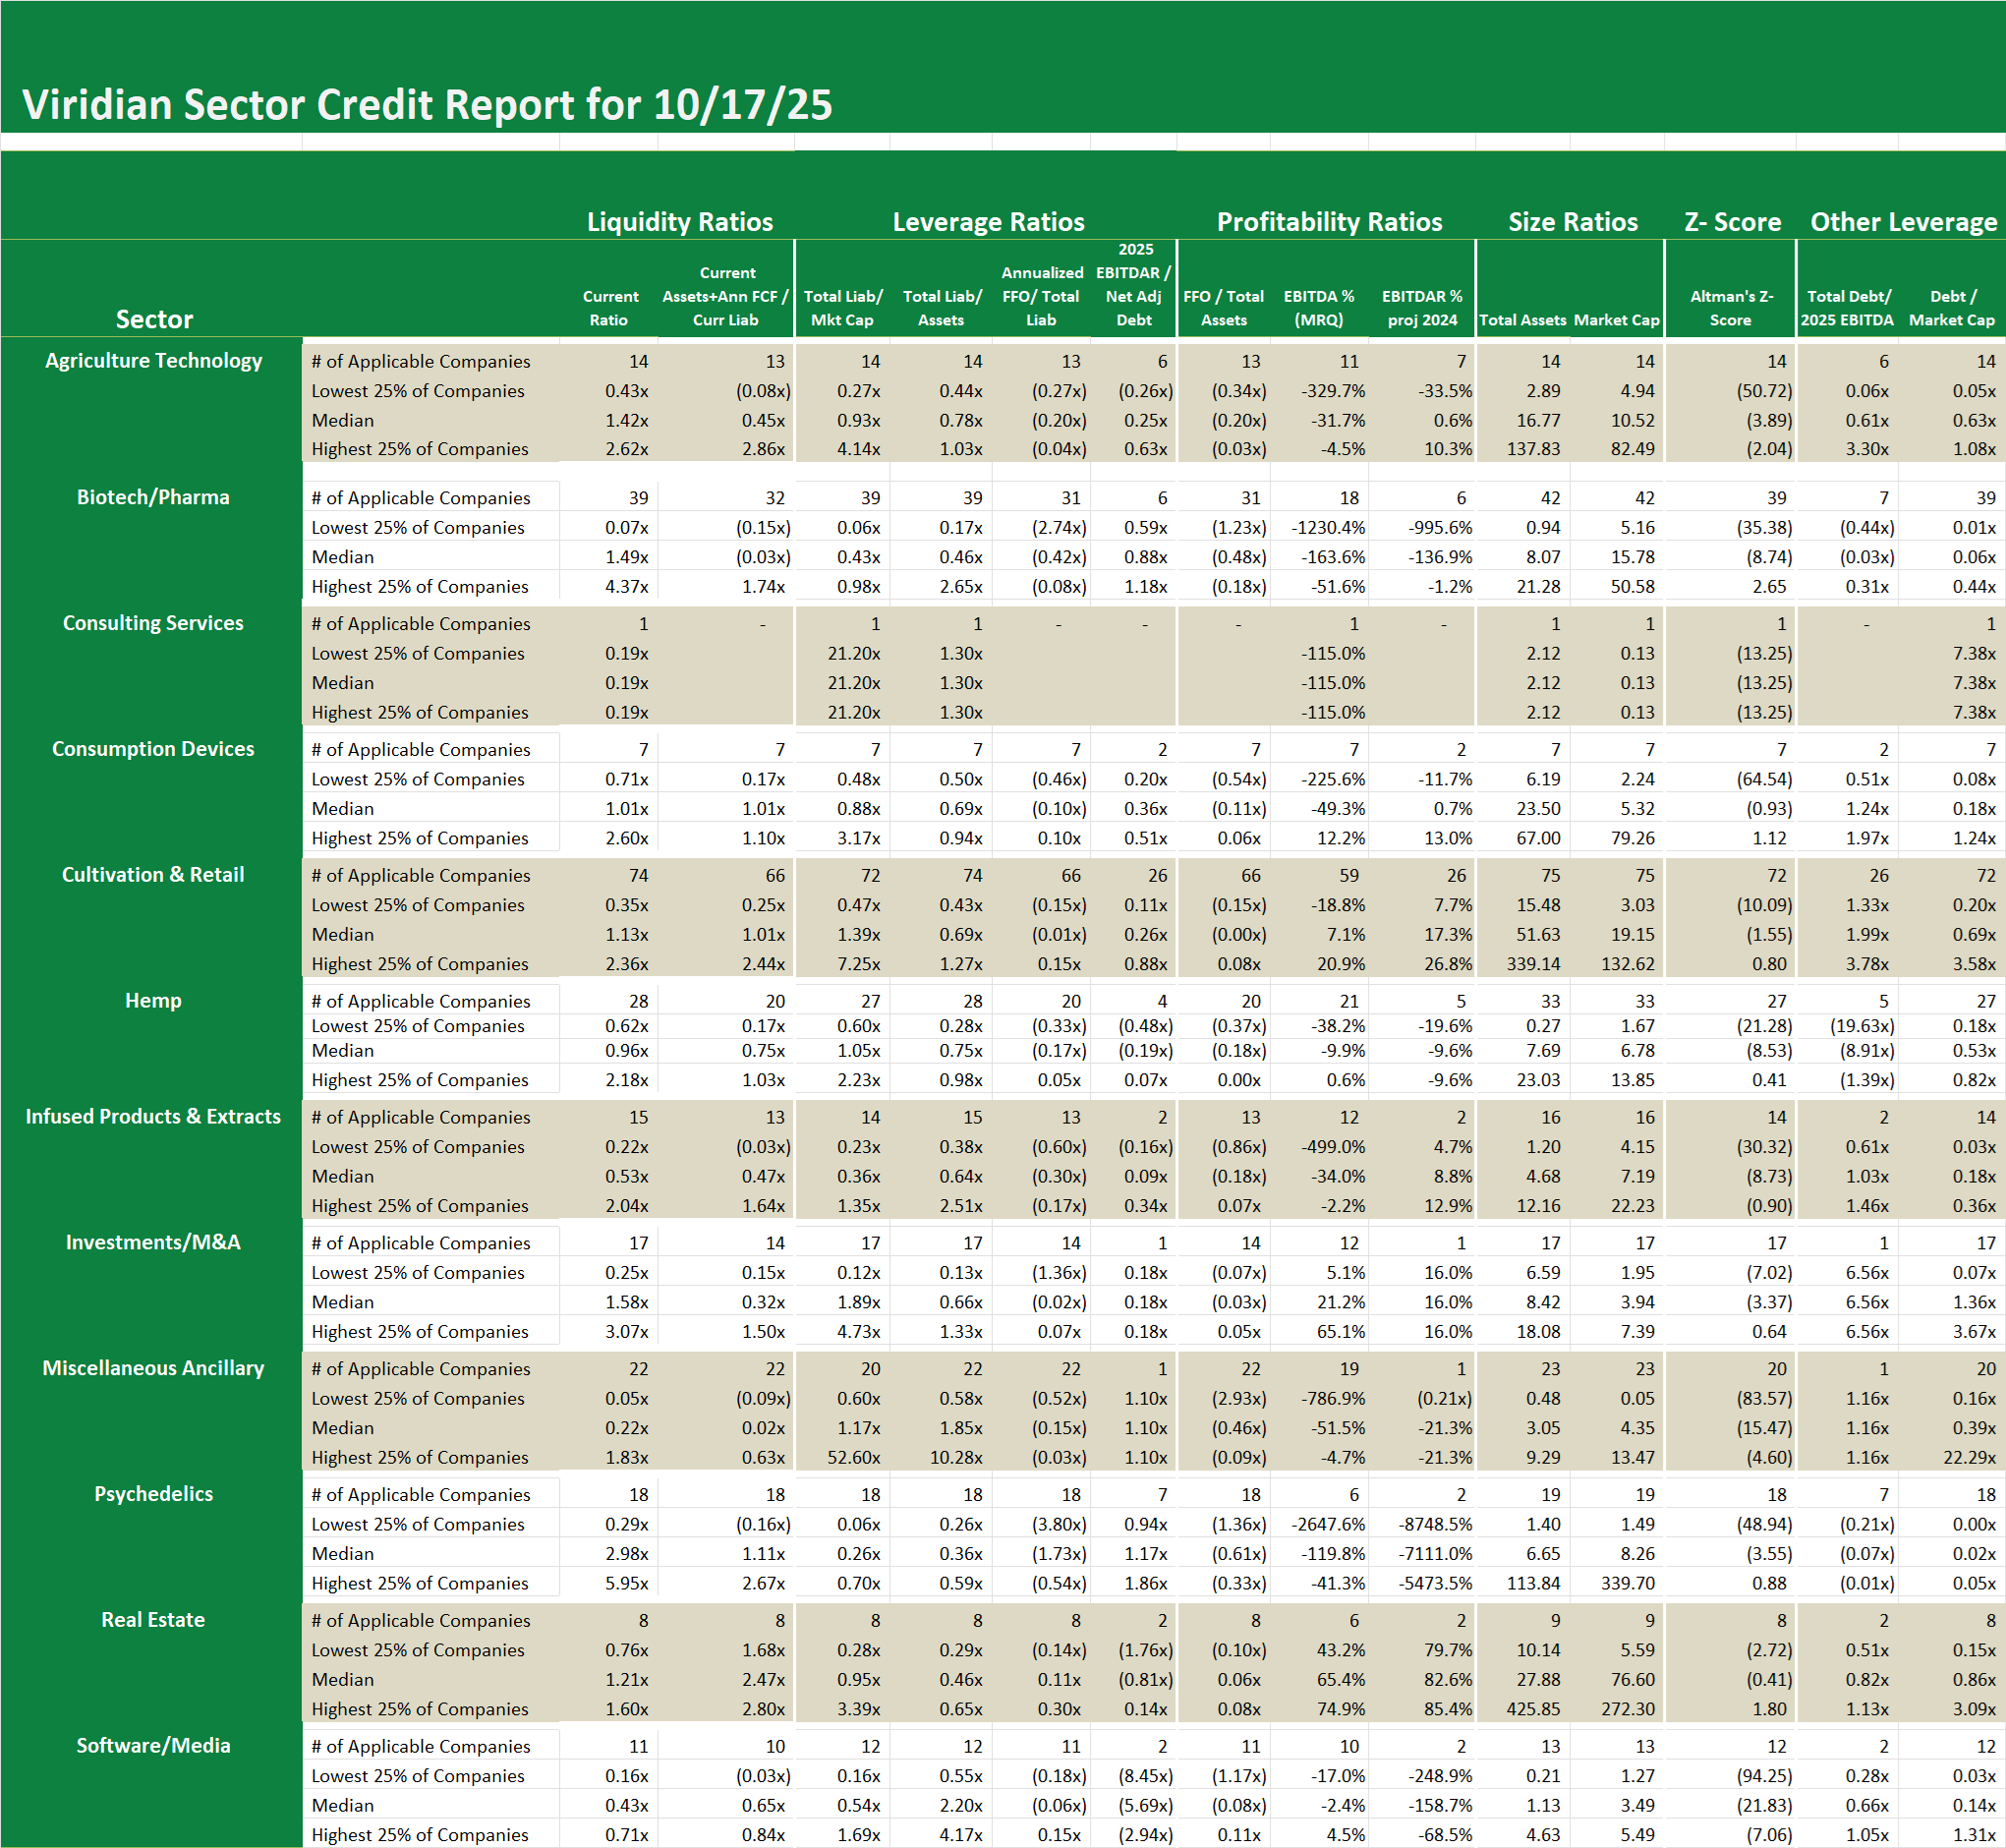
Credit ratings are not currently available for public cannabis companies leaving companies, lenders and investors with a gap of information. The Viridian Cannabis Credit Tracker fills this gap. The model uses 11 market and financial statement variables to discern 4 key credit factors: Liquidity, Leverage, Profitability, and Size, to provide credit/liquidity analysis for over 370 public Cannabis/Hemp companies.
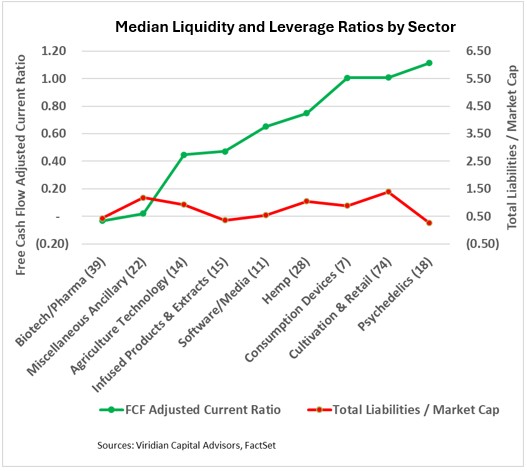
Weekly Sector Credit – Median Liquidity and Leverage Ratios by Sector
- We are used to the Psychedelics sector having one of the lowest leverage metrics as measured by total liabilities to market cap. The sector is clearly not well-suited to debt financing. Largely negative cash flow due to R&D and clinical trial expenses, the sector also has relatively few hard assets to use as collateral.
- The sector’s key credit challenge has always been maintaining sufficient liquidity amid negative free cash flow. Surprisingly, Psychedelics currently has the highest median free cash flow adjusted current ratio. What is behind this apparent anomaly? Looking at the 1st quartile of -0.16x and the 3rd quartile of 2.67x tells the story. The psychedelics sector has enormous internal variation. The bottom 25% of companies are experiencing a severe liquidity crisis, while the top 25% are the most liquid of any sector we cover.