OUR 9TH YEAR OF PROVIDING PROPRIETARY CAPITAL MARKETS INTELLIGENCE ON THE CANNABIS / HEMP / PSYCHEDELIC SECTORS
The Viridian Capital Chart of the Week highlights key investment, valuation and M&A trends taken from that week’s Deal Tracker that we believe are impactful for investors, companies and acquirers.
- Most people know that eliminating 280E would improve cannabis companies’ cash flows and debt capacity; however, the exact mechanism of this improvement and the extent of the improvement are not widely understood.
- The Viridian Chart of the Week explores the impact of the elimination of 280E on three types of operators, High Performers, Medium Performers, and Low Performers, in order to model the degree to which S3 would impact their relative debt capacity.
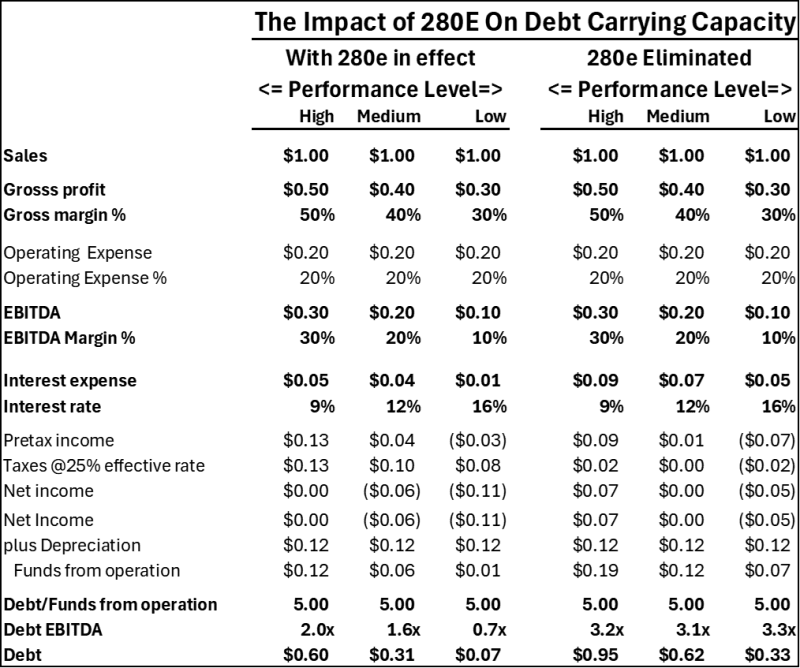
- We modeled hypothetical firms, each having $1 of sales. The High, Medium, and Low performance categories are defined by gross margin: high performers at 50%, medium performers at 40%, and low performers at 30%. We maintained operating expenses at 20% for all three performance categories.
- We calculate taxes at a 25% rate based on gross profit under 280E and on pretax income under S3.
- We also varied interest rates across high-, medium-, and low-performing categories at 9%, 12%, and 16%, respectively.
- The key realization for modeling debt capacity is that it is not limited by interest coverage as much as by payback capacity. Lenders do not just want to see that companies can “carry” their debt; they also want to know that they can actually pay it off in a reasonable period of time. We have used a 5-year debt payback, calculated as Debt/Funds from Operations, as our guideline.
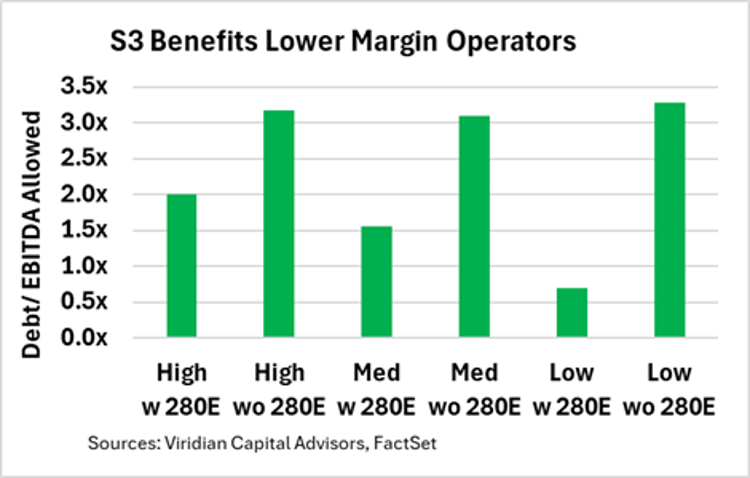
- With 280E in effect, high-performing cannabis companies can afford only approximately 2.0x debt/EBITDA and still pay back debt in 5 years. As you move down the performance levels, debt capacity under 280E drops to 1.6x for medium performers and 0.7x for low performers.
- After rescheduling, debt capacity rises to around 3.2x for all performance levels.
- The chart shows that the relative increase in debt capacity becomes more pronounced for lower-performing classes. Some commentators have argued that S3 would chiefly benefit larger, more profitable enterprises; however, our hypothetical model’s results contradict this view. Post S3, high-performance companies would be able to safely maintain about $0.95 in debt for every $1 in revenue, up about 58%. Low performers would be able to support around $0.33 debt for every $1 of revenue, an increase of approximately 371%.
- Rescheduling will indeed increase debt capacity across the board but the impact is not as simple as many think.