OUR 9TH YEAR OF PROVIDING PROPRIETARY CAPITAL MARKETS INTELLIGENCE ON THE CANNABIS / HEMP / PSYCHEDELIC SECTORS
The Viridian Capital Chart of the Week highlights key investment, valuation and M&A trends taken from that week’s Deal Tracker that we believe are impactful for investors, companies and acquirers.
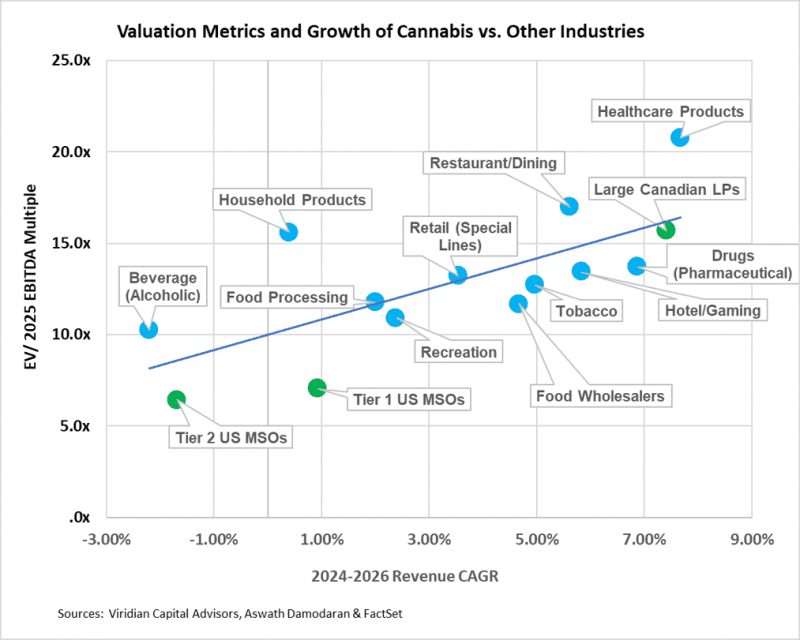
- The Viridian Chart of the Week displays Enterprise Value to 2025 consensus EBITDA multiples on the vertical axis, against 2024-2026 Revenue CAGR on the horizontal axis, for fourteen different industry groupings, including Tier 1 & 2 US MSOs and large Canadian LPs.
- We last explored this topic in the January 24, 2025, Viridian Capital Chart of the Week and wanted to investigate the impact of changing rescheduling expectations on the industry’s relative positioning. Cannabis stocks, as measured by the MSOS ETF, have staged a major rally, rising 57% YTD. In comparison, the S&P500 is only up about 8.15% YTD. Our intuition was that the strong recent rally, occurring amid slowing growth expectations, would result in the cannabis industry looking less undervalued now than it did in January. However, the US Tier 1 and Tier 2 companies are still trading well below the regression line expectations.
- We used data from 260 companies organized into 14 different industry categories. The assignment of companies into industry groupings follows the work of Aswath Damodaran, a noted finance professor at NYU. Valuation multiples and revenue growth rates were calculated by aggregating all companies in the industry group before calculating the respective ratios. Cannabis sectors are represented on the chart in green circles. The seven Tier 1 US MSOs are expected to have a 0.91% compounded revenue growth rate for the 2024-2026 period, down from approximately 5% when we conducted this analysis in January. Tier 2 MSOs have a lower expected growth rate of -1.7%.
- The Tier 1 group has a 7.03x EV/ 2025 EBITDA multiple (compared to 4.16x in January 2025) is significantly lower than any other industry group despite its expected 2025 EBITDA margin of 27.1%, the fourth-highest behind Tobacco (49.4%), Pharmaceuticals (40.4%), and Healthcare Products (27.8%). Large Canadian LPs appear to be fairly valued at 15.7x, more than twice the valuation of their US counterparts.
- We note that US cannabis EBITDA is not strictly comparable to that of other sectors due to the impact of Section 280E. Deflating EBITDA by .7 to account for relative tax treatments (admittedly a very rough approximation) would produce a 10.1x multiple, still around 2 points lower than the regression estimate. The remaining gap is likely related to the sector’s low liquidity stemming from trading on junior exchanges. Support for this view comes from the fact that the large Canadian LPs are trading close to the predicted line.
- We expect S3 to add around three points to the trading multiples of the Tier 1 MSOs, but it will still require banking reform and possibly an attorney general letter to achieve the rest of the re-rating.