OUR 9TH YEAR OF PROVIDING PROPRIETARY CAPITAL MARKETS INTELLIGENCE ON THE CANNABIS / HEMP / PSYCHEDELIC SECTORS
The Viridian Capital Chart of the Week highlights key investment, valuation and M&A trends taken from that week’s Deal Tracker that we believe are impactful for investors, companies and acquirers.
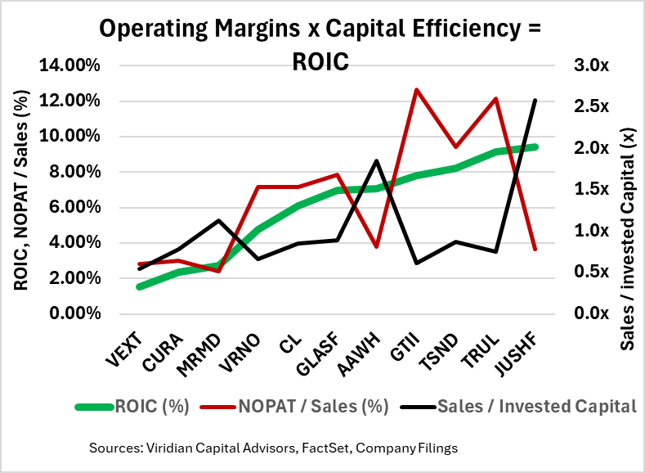
- We calculated projected 2025 ROIC (Return on Invested Capital) for each of the eleven companies on the chart by first calculating NOPAT (Net Operating Profit After Tax) by taking consensus estimates of 2025 Operating Income and tax effecting them using a 25% tax rate, making the aggressive assumption that 280e will be resolved in time for 2025 taxes. We then divided NOPAT by Invested Capital (Book Equity plus Debt minus Cash.) The resulting ROIC is depicted by the green line on the graph. We then broke ROIC down into two components: Net Operating Profit after Tax/Sales (represented by the red line) and Sales/Invested Capital, a measure of capital efficiency, depicted by the black line.
- The ROICs range from 1.53% for Vext Science (Vext: CSE) to 9.40% for Jushi (JUSH: CSE). Financial theory tells us that if a company’s ROIC is greater than its weighted average cost of capital (WACC), then it creates value for its owners. But if ROIC < WACC, then value is being destroyed.
- The table below the chart does some indicative WACC calculations based on the following assumptions in the Capital Asset Pricing Model (CAPM):
- Risk-free rate 4.22%
- Market risk premium 4.48%
- Cannabis risk premium 3%
- Debt rates that vary from 10% to 22% as leverage increases
- None of the eleven companies has projected 2025 ROICs that exceed their WACCs.
- One reason for poor ROICs is that projected operating margins have been cut and are now expected to be below those of 2024. GTI, TerrAscend, and Trulieve have the highest projected 2025 after-tax operating margins at 12.6%, 9.4%, and 12.2%, respectively. We note that we were generous in assuming a 25% combined Federal and State effective income tax rate, which is far too low in a 280E environment.
- The larger issue, however, seems to be capital efficiency. The group’s average Sales/Invested Capital ratio is only 0.80x, which implies that for every dollar of sales added, $1.25 of extra capital is required, which cannot be internally funded given the group’s after-tax profitability (even assuming no 280e). Jushi (JUSHF: CSE) is the only company on the chart that requires less than $1 of capital per dollar of sales.
- Cannabis needs to become more capital-efficient to both earn solid returns on invested capital and internally fund growth. Progress towards this goal is likely to come from the intrastate consolidations we are seeing in markets like Missouri and Michigan. We are also seeing a trend for capacity elimination as troubled firms shut down costly cultivation sites.
- On a longer-term basis, intrastate commerce will allow significant capacity consolidation and materially improve the group’s capital efficiency and ROIC. Look for the big to become much bigger.