OUR 9TH YEAR OF PROVIDING PROPRIETARY CAPITAL MARKETS INTELLIGENCE ON THE CANNABIS / HEMP / PSYCHEDELIC SECTORS
The Viridian Capital Chart of the Week highlights key investment, valuation and M&A trends taken from that week’s Deal Tracker that we believe are impactful for investors, companies and acquirers.
- Cannabis companies are recognizing the theme of ROIC maximization, investing in going deep in markets where they can be a significant factor and obtain economies of scale while scaling back or eliminating territories where they can’t. Companies that successfully execute this strategy will be rewarded by superior valuation multiples or become attractive takeout candidates.
- This week’s Viridian Chart of the Week presents two different views of an issue that may restrain new capital investment into the cannabis industry: even if rescheduling occurs, the cannabis industry’s projected 2026 return on invested capital (ROIC) is too low to justify the amount of capital it employs.
- Finance theory teaches us that if Return on Invested Capital (ROIC is less than Weighted Average Cost of Capital (WACC), that company (or industry) is destroying value rather than creating it. Investors would be better off if the firm or industry returned capital by stock repurchases or dividends.
- Return on Invested Capital is defined as After-Tax Operating Income divided by Invested Capital. This ratio can be decomposed into two more fundamental measures: Revenues / Invested Capital x After Tax Operating Income / Revenues = ROIC.
- Revenues / Invested Capital can be thought of as a measure of capital intensity; A company with a lower Revenues / Invested Capital requires more additional capital to add $1 of incremental revenue. The second ratio, After Tax Operating Income / Revenues ( measured on the horizontal axis), is a measure of after-tax profitability. In calculating these ratios, we have consistently used a marginal tax rate of 25%. Accordingly, our figures already give cannabis companies credit for the elimination of 280E. In each case, we used consensus estimates of 2026 revenues and EBITDA and information from June 2025 balance sheets to calculate invested capital (book equity plus debt-cash).
- There are essentially two ways to increase ROIC: more profitable projects or investments that are less capital-intensive.

- The graph above examines the components of ROIC for cannabis relative to other industries that are frequently compared to cannabis or considered potential acquirers of cannabis companies. All non-cannabis industries are displayed with blue circles, while three sectors of cannabis (Large Canadian LPs, Tier 1 US MSOs, and Tier 2 US MSOs) are shown by green circles. The red line shows the hypothetical combinations of factors that would create an ROIC of 10%—moving in the direction of up or to the right increases ROIC. Of the fourteen industry sectors (including cannabis) on the graph, 10 of them are above the 10% ROIC line. The three cannabis sectors have the lowest ROICs on the chart, both due to low profitability and low capital productivity.
- What will it take to improve the ROIC of cannabis? Consolidation of the industry may result in more oligopolistic pricing and allow for higher operating margins, and we are seeing this happen at the intrastate level. Similarly, although big jumps in asset efficiency may require full legalization and interstate commerce, allowing firms to centralize production and distribution, we do see positive moves in this direction in the ongoing process of divesting less profitable/productive markets. Examples include Trulieve leaving Massachusetts, Curaleaf abandoning most of the Western States, and the current restructuring of AYR, which will result in the closing of several non-core markets.
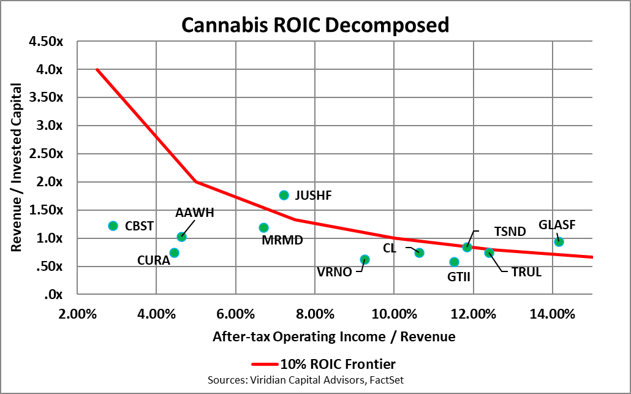
- The second graph above breaks out the components of ROIC for each of the eleven companies we used in our cannabis Tier 1 and Tier 2 aggregates. Note that only four companies, including Jushi, TerrAscend, Trulieve, and Glass House, are at or above the 10% ROIC frontier, which we believe is a reasonable estimate of minimum WACC for the industry. Jushi has mid-range profitability but excels in producing the highest revenue-to-invested-capital ratio of the group. In contrast, Glass House has strong projected operating margins with median revenue to invested capital. Both approaches can be successful.