OUR 9TH YEAR OF PROVIDING PROPRIETARY CAPITAL MARKETS INTELLIGENCE ON THE CANNABIS / HEMP / PSYCHEDELIC SECTORS
The Viridian Capital Chart of the Week highlights key investment, valuation and M&A trends taken from that week’s Deal Tracker that we believe are impactful for investors, companies and acquirers.
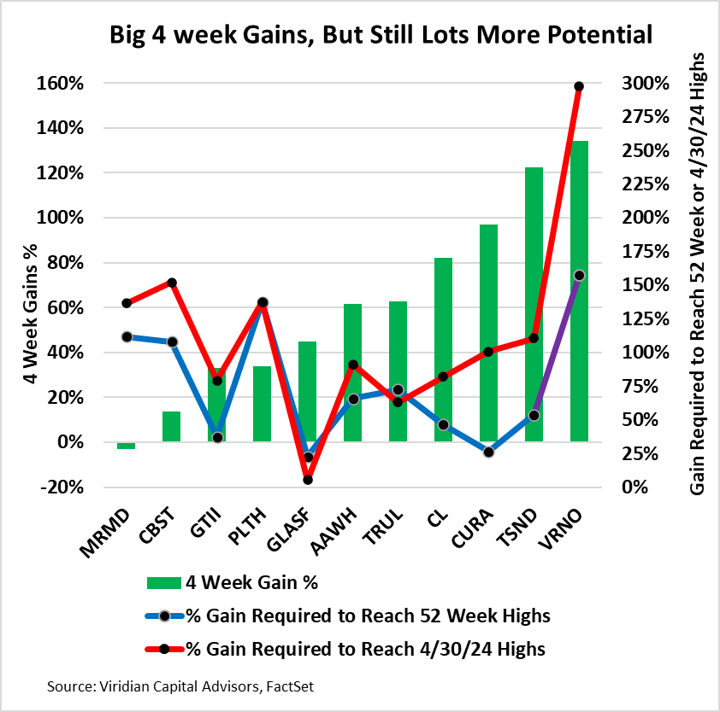
- Cannabis Prices, as represented by the MSOS ETF, are up about 79% over the last month, so it’s a natural question to ask whether they have run too far or how much further room for increases still exists.
- The Viridian Chart of the Week displays the percent price gains over the last month (green bars measured on left axis), the percent increase from prices to get back to each stock’s 52 week high (purple line measured on right axis), and the percent gain that would be required to get back to the prices on 4/30/24, the date that the DEA announced it would propose reclassifying cannabis to Schedule III.
- Only one of the eleven companies on the chart, Marimed (MRMD: CSE)(MRMD: OTCQX), is down over the last month. Gains for the other stocks range from 14% for Cannabist to 134% for Verano.
- Why did the gainers outperform the others so soundly? One reason is size: the smaller market cap companies on the chart, including MariMed, Cannabist, and Planet 13, all experienced smaller gains as incremental investment shifted to larger market caps. Another factor is liquidity. We don’t think it’s an accident that two of the largest gains were achieved by CURA and TSND, which trade on the TSX exchange. TXS listings are eligible for many Canadian institutions, ETFs (including the MSOS), and retail brokerages, thereby widening the investor base. Another consideration is that many of these names had become oversold, and this is true of the top gainer, Verano. After gaining 134% in the last month, it would still need a 157% gain to return to its 52-week high.
- The purple line indicates that Green Thumb, Glass House, and Curaleaf have rebounded to within 40% of their 52-week highs, suggesting potential for a near-term pullback. But we do not consider the 52-week highs to be instructive about gain potential from S3.
- The last multi-year high occurred on April 30, 2024, when the DEA announced that it would propose rescheduling to Schedule 3. The market shot up dramatically, with aggregate EV/Next Twelve Month EBITDA multiples for GTI, TRUL, CL, CURA, TSND, and VRNO rising to 10.91x, compared to 6.48x currently. The price levels achieved then form a conservative level for what would happen if S3 is enacted. The red line indicates significant further gains from a return to those levels.
- Before that peak, another instructive peak was achieved on April 1, 2022, when the MORE Act was introduced, and the same group traded to a bit over 11 times. An actual enactment of S3 is likely to achieve levels even higher than that, as there is a substantial difference between an announcement and an actual enactment of reform that directly impacts cash flows. All considered, perhaps aggregate multiples of 13x are reasonable?
- Still, we are cautious in predicting a return to past prices or multiples. Many things have changed since April 1, 2022, let alone the absolute peaks of February 2021. As of April 1, 2022, the six MSOS mentioned above were projected to have NTM EBITDA margins of 32.9%, compared to estimates of 27.5%. Growth projections were also higher at that time, as New Jersey, New York, Missouri, Ohio, and Rhode Island had yet to see their first adult rec sales. And it was 2022 when the term “wholesale price compression” crept into virtually every cannabis earnings call and was built into BDSA projections as a factor for every market.
- The Bottom line is that we do not think multiples will return to anywhere close to their all-time peaks of over 20x, but still substantial room for price growth and multiple expansion.